
Most early-stage hydrogen project conversations start in the wrong place. The deck on the table shows an AWE vs. PEM comparison. The RFP asks for stack efficiency at nameplate load. The technical committee wants to know the electrolyzer vendor's track record.
All of that matters, eventually. But it is the second-order question. The first-order question is simpler and more consequential: how many hours per year will your electrolyzer actually run?
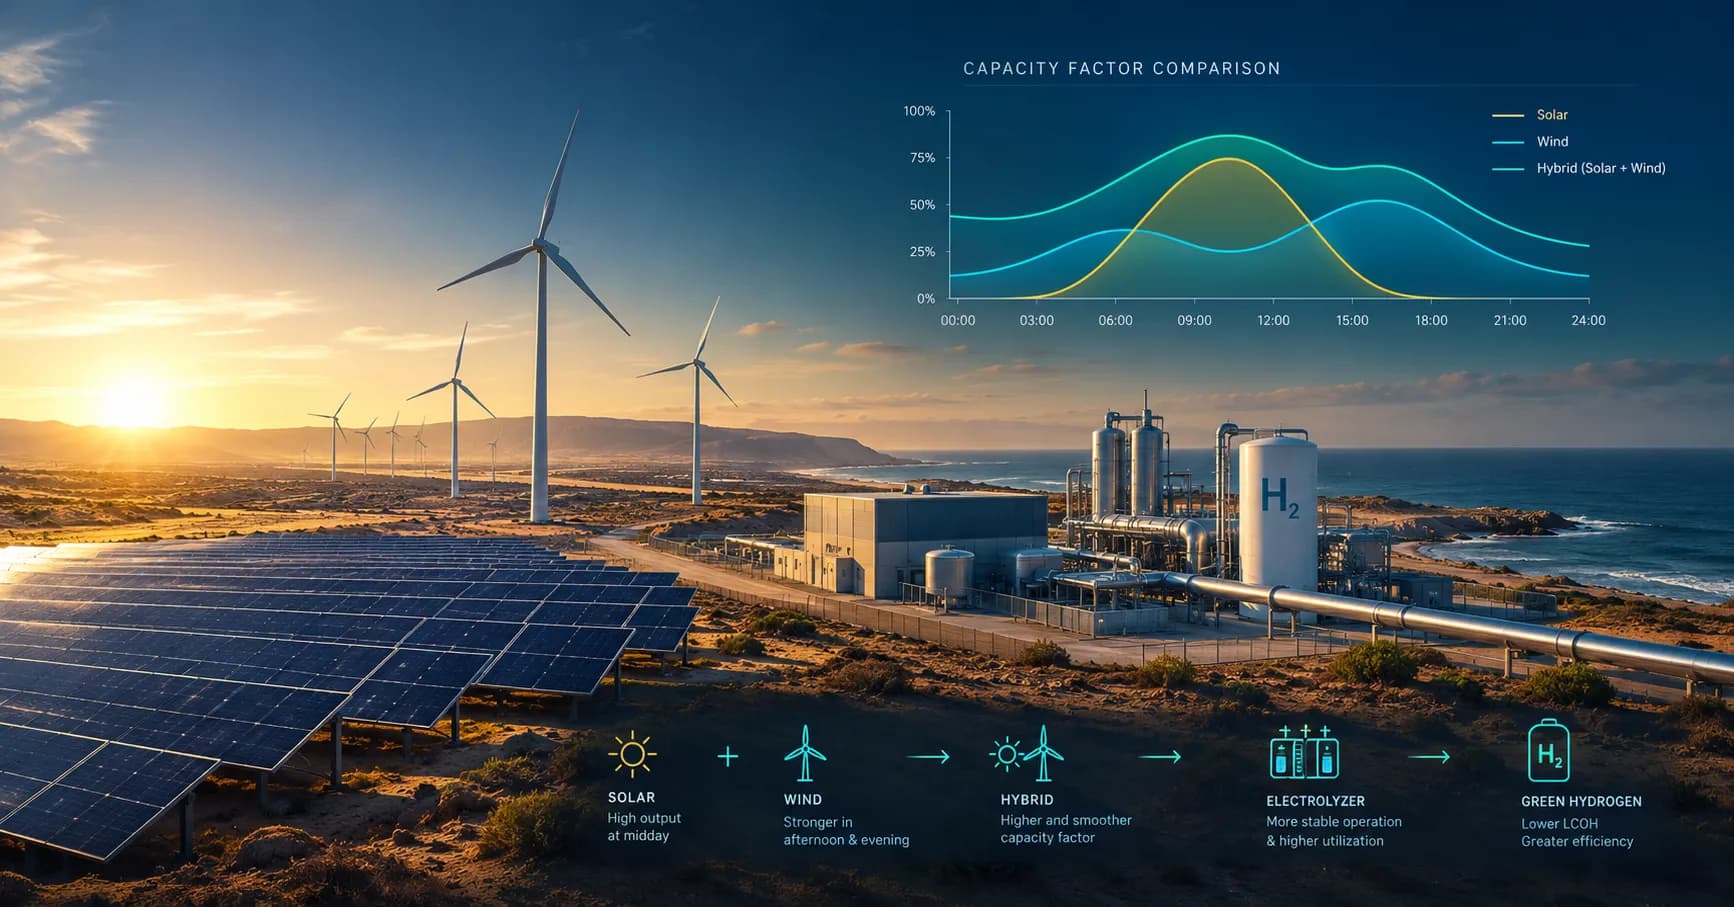
That question is answered entirely by your renewable energy configuration. And the quantitative case for hybrid solar-wind over single-source RE is, once you see the numbers, difficult to argue against.
This article presents those numbers, grounded in peer-reviewed results from five Moroccan sites including Dakhla, one of the world's highest-performing hybrid resource locations, and translates them into $/kg LCOH impact that belongs in every pre-FEED economic model.
The core finding: A 10 percentage-point increase in electrolyzer capacity factor reduces LCOH by more than any equivalent investment in better electrolyzer technology. At typical utility scale, the CF effect is 3–5× larger than the sensitivity to electrolyzer CAPEX. The RE configuration decision (solar-only, wind-only, or hybrid) is therefore the highest-leverage choice a developer makes at pre-FEED.
1. Why Capacity Factor Dominates LCOH
The formula
The Levelized Cost of Hydrogen is defined as:
LCOH = [CAPEX + Σ(OPEX_t + Replacement_t) / (1+d)^t] / Σ E_H₂,t
Where E_H₂,t is annual hydrogen production (kg), d is the discount rate, and the sum runs over project lifetime T (years).
The denominator is annual hydrogen production. And annual hydrogen production is, to first order, the product of electrolyzer rated capacity and the fraction of hours it operates, which is precisely the capacity factor (CF):
E_H₂ ≈ P_elz × CF × 8,760 h/yr × η_spec⁻¹
Where P_elz is electrolyzer rated power (kW), CF is capacity factor (dimensionless), and η_spec is specific energy consumption (kWh/kgH₂). Typical η_spec: 50–55 kWh/kg for AWE, 50–57 kWh/kg for PEM at rated load.
CF appears in the denominator of LCOH. That is the structural reason it dominates: a 10 percentage-point improvement in CF increases the denominator approximately proportionally, spreading the same fixed costs over more kilograms of hydrogen. The CAPEX numerator does not change. Because LCOH falls roughly as 1/CF, the gain per percentage point is steepest at low CF and shrinks as CF rises. It also holds only within the operating regime where additional RE generation hours are actually harvested rather than curtailed.
Worked example: 100 MW electrolyzer at pre-FEED stage
Baseline assumptions: P_elz = 100 MW, η_spec = 52 kWh/kgH₂, project lifetime 25 yr, discount rate 5%, total system CAPEX = $350M (RE + electrolyzer + BoP), annual OPEX = 2.5% of CAPEX. Stack replacement is excluded to keep the example self-contained.
Step 1: Annualized cost. The capital recovery factor spreads the CAPEX over the project life:
CRF = d × (1+d)^T / [(1+d)^T − 1] = 0.05 × 1.05^25 / (1.05^25 − 1) = 0.0710 per year

Annual capital charge = $350M × 0.0710 = $24.8M/yr
Annual OPEX           = $350M × 0.025  = $8.75M/yr
Total annual cost     =                   $33.6M/yr
Step 2: Annual production and LCOH at three capacity factors.
Case A: CF = 28% (solar-only, good site) Annual H₂ = 100,000 kW × 0.28 × 8,760 / 52 = 4,717 tpa LCOH = $33.6M / 4,717 t ≈ $7.12/kg
Case B: CF = 38% (+10 pp, modest hybrid improvement) Annual H₂ = 100,000 kW × 0.38 × 8,760 / 52 = 6,402 tpa LCOH = $33.6M / 6,402 t ≈ $5.25/kg
Case C: CF = 51% (Dakhla-class hybrid performance) Annual H₂ = 100,000 kW × 0.51 × 8,760 / 52 = 8,592 tpa LCOH = $33.6M / 8,592 t ≈ $3.91/kg
LCOH reduction from CF alone: ~$1.00–1.90/kg per 10 pp CF gain, depending on the starting CF. Going from 28% to 38% CF saves $1.87/kg. Going from 38% to 51% saves $1.34/kg over 13 pp, or about $1.03/kg per 10 pp. The lever is strongest where CF is lowest. These figures come from a simplified fixed-cost model with flat CAPEX; actual values at 100 MW scale will differ with CAPEX structure, WACC, and stack replacement.
Why this differs from our AWE vs. PEM article. The sensitivity of LCOH to CF scales with the annualized fixed cost of the system. The range above reflects an RE-heavy, off-grid cost structure ($350M for 100 MW, about $3,500/kW all-in). Our AWE vs. PEM comparison quotes $0.30–0.60/kg per 10 pp, which implies a lower fixed-cost base, for example a grid-connected case or lower RE cost. Both are valid in their own context: the CF lever is proportionally larger when fixed costs are higher.
CF sensitivity vs. electrolyzer CAPEX sensitivity
The Sebbahi et al. paper quantifies this trade-off directly for a 20 kW AWE system at five Moroccan sites. The sensitivity analysis varied electrolyzer CAPEX across 650–2,300 $/kW while holding other parameters constant. The result: electrolyzer CAPEX variation produced LCOH shifts of less than ±0.5 $/kgH₂ across all studied locations.
By contrast, the paper found that relaxing CF from 100% to 70% reduced LCOH by 39.6% to 69.5% depending on location, equivalent to several dollars per kilogram. Battery CAPEX and PV CAPEX were identified as the dominant cost drivers at high CF targets, while electrolyzer CAPEX remained comparatively small in all scenarios.
Key figures directly from the paper:
- 69.5%: maximum LCOH reduction from CF optimization (100% → 70% CF)
- <±0.5 $/kgH₂: LCOH shift from full electrolyzer CAPEX range (650–2,300 $/kW)
- ±4.27 $/kgH₂: LCOH shift from battery CAPEX variation (the dominant driver)
- 50.85%: optimum CF achieved at Dakhla, highest in the five-site study
Practical implication: Negotiating a 15% reduction in electrolyzer CAPEX with your vendor moves LCOH by roughly $0.10–0.15/kg. Finding a site with 10 pp better capacity factor moves it by $1.00–1.90/kg at the cost base above. These are not the same lever.
2. Why Solar-Only Underperforms
The structural problem
Solar photovoltaic is excellent at doing one thing: converting direct and diffuse irradiance into electricity during daylight hours. This is also its fundamental limitation for electrolyzer applications. A solar-only system is structurally idle for approximately half of every 24-hour cycle, not due to weather, not due to equipment failure, but due to planetary geometry. No matter how good the site, nighttime produces zero solar generation.
The second structural constraint is seasonal variation. At Moroccan latitudes (24°–34°N), daily insolation varies significantly between summer and winter, with peak GHI months outperforming winter months by a factor of 1.5 to 2.0. This creates a systematic production trough in Q1 and Q4, directly reducing annual average CF.
Cloud cover and aerosol loading add variability on top of these deterministic patterns. Even at exceptional solar sites, daily GHI can vary by ±30–40% from the annual average on a given day.
What the numbers show
The Sebbahi et al. study found that PSO-optimized solar-only systems at four of the five Moroccan sites (Benguerir, Laayoune, El Jadida, and Tan-Tan) converged to electrolyzer capacity factors between 27% and 29%. Dakhla, the only location where the optimizer selected a hybrid configuration, achieved 50.85% CF.
To put 27–29% CF in concrete terms: a solar-only electrolyzer at a good Moroccan site is producing hydrogen for roughly 2,365–2,540 hours per year. It is idle for over 6,200 hours per year. The capital invested in the electrolyzer stack, and in any downstream compression, purification, and storage infrastructure sized to nameplate capacity, is generating zero return during those 6,200 hours.
| Location | Annual avg. GHI (W/m²) | Avg. wind speed (m/s) | Optimal RE config | Optimal CF (%) | LCOH ($/kg) |
|---|---|---|---|---|---|
| Benguerir | 242.8 | 3.06 | PV-only | ~28 | 3.70 |
| Laayoune | 250.9 | 5.53 | PV-only | ~29 | 3.67 |
| El Jadida | 237.6 | 3.89 | PV-only | ~27 | 3.69 |
| Tan-Tan | 234.9 | 4.98 | PV-only | ~28 | 3.82 |
| Dakhla | 257.4 | 7.01 | PV + Wind | 50.85 | 3.18 |
Source: Sebbahi et al., Journal of Power Sources 677 (2026) 240015. CF values for solar-only sites are PSO-optimized results.
The optimizer's selection of PV-only at Benguerir, Laayoune, El Jadida, and Tan-Tan is itself a finding: at these sites, wind resources are insufficient to justify the added wind turbine CAPEX. The CF ceiling for solar-only, approximately 27–32% at MENA sites, is structural, not improvable through better panels or inverters.
3. Why Wind-Only Has Limits Too
What wind-only does better
Wind generation is not constrained by daylight hours. A well-sited wind turbine produces electricity across the full 24-hour cycle, including overnight hours when solar is zero. This structural advantage is real: wind-only systems at high-quality sites regularly achieve capacity factors of 38–48%, substantially higher than the 27–29% achievable with solar-only at the same locations.
Wind also provides a different seasonal profile. In many locations, wind resource peaks in winter months, the opposite of solar, which means wind-only LCOH is somewhat less sensitive to seasonal troughs than solar-only.
The limits wind-only cannot escape
Wind generation has its own gaps that solar cannot escape. Wind calms are unpredictable and can persist for days, which is fundamentally different from the deterministic nighttime zero of solar, which can be planned around. A multi-day wind calm at a wind-only site shuts down the electrolyzer for a period that no dispatch optimization can avoid.
Seasonal wind lulls exist at most sites, though they do not align with solar seasonal lulls, which is precisely the complementarity argument for hybrid systems. The key limitation of wind-only relative to hybrid is not mean CF but variability: the standard deviation of hourly wind output is higher than for hybrid systems with partial solar smoothing.
The Sebbahi et al. study found no site at which wind-only was the PSO-optimal configuration. At Dakhla, the highest-wind site (7.01 m/s mean), the optimizer selected a hybrid configuration with wind as the primary contributor, not wind-only.
4. Why Hybrid Wins: The Complementarity Argument
Anti-correlation as an engineering asset
The fundamental reason hybrid systems outperform single-source RE is not that they have more total installed capacity. It is that solar and wind generation profiles are partially anti-correlated in time. The value of anti-correlation is that when one source is low, the other tends to be higher, reducing the probability of simultaneous low generation from both sources.
Two drivers create this anti-correlation:
Diurnal anti-correlation: Solar generation follows the sun's arc, zero at night and peak at solar noon. Wind generation at many coastal and open sites tends to be lower during peak daytime hours (when thermal gradients are more stable) and higher in evening/nighttime periods. The result is a partial offset across the 24-hour cycle.
Seasonal anti-correlation: At many MENA and Atlantic sites, wind resource is stronger in winter months, when solar irradiance is at its seasonal minimum. This creates a seasonal complementarity that partially flattens the annual generation profile.
The complementarity index C is defined as the Pearson correlation between hourly PV and wind output profiles:
C = Pearson_r(P_PV, P_wind)
It ranges from −1 (perfectly anti-correlated, ideal) to +1 (identical profiles, no complementarity benefit). A negative C indicates anti-correlation, which is the entire case for hybridization: wind fills solar's night. A C value below −0.3 indicates meaningful complementarity worth pursuing in system design, while C > 0 means the two resources peak together and add little.
The Dakhla result: 50.85% CF vs. 27–29% for solar-only sites
The headline number from the Sebbahi paper is unambiguous: Dakhla achieves an optimized electrolyzer CF of 50.85% with a hybrid PV-wind configuration (18.9 kW PV + 30 kW WT), producing 1,572 kg H₂ in year 1, which is between 81% and 89% more hydrogen than the four PV-only sites.
The cost structure reflects this directly:
| Location | RE Config | CF (%) | Electrolyzer share of LCOH (%) | PV share (%) | Wind share (%) | LCOH ($/kg) |
|---|---|---|---|---|---|---|
| Benguerir | PV-only | ~28 | 31–33 | 42–44 | n/a | 3.70 |
| Laayoune | PV-only | ~29 | 31–33 | 42–44 | n/a | 3.67 |
| El Jadida | PV-only | ~27 | 31–33 | 42–44 | n/a | 3.69 |
| Tan-Tan | PV-only | ~28 | 31–33 | 42–44 | n/a | 3.82 |
| Dakhla | PV + Wind | 50.85 | 20.4 | 16.7 | 38.1 | 3.18 |
Source: Sebbahi et al. (2026). Cost structure percentages are derived from LCOH component analysis.
At Dakhla, the wind turbine accounts for 38.1% of LCOH, PV drops to 16.7%, and the electrolyzer contribution falls to just 20.4%, compared to 31–33% at the solar-only sites. The electrolyzer's lower cost share is a direct consequence of higher utilization: the same capital investment is amortized over nearly twice as much hydrogen production.
Translating the CF gain to $/kg
From the Sebbahi paper's CF sensitivity analysis: moving from CF = 100% to CF = 70% at Dakhla produced LCOH reductions of 39.6–69.5% across the studied range. At the optimized CF of 50.85%, Dakhla achieves $3.18/kg against $3.67–3.82/kg for the solar-only sites, a savings of $0.49–0.64/kg purely from the hybrid resource complementarity at 20 kW scale.
At 100 MW, scaled proportionally, this gap represents tens of millions of dollars in annual revenue difference over a 25-year project life.
5. Sizing the Hybrid System: The Practical Question
How do you find the optimal solar-to-wind ratio?
The ratio question cannot be answered analytically from mean resource statistics alone. You need the full 8,760-hour chronological profile for both resources simultaneously, because the value of complementarity depends on the hour-by-hour correlation structure, not just the annual averages.
At Dakhla in the Sebbahi paper, the PSO optimizer converged to 18.9 kW PV and 30 kW wind for a 20 kW electrolyzer, a wind-to-total ratio of approximately 61%, and a total installed RE capacity of 48.9 kW for 20 kW of electrolyzer nameplate, giving a renewable oversizing ratio of ~2.4×. This ratio reflects the specific resource profiles, CAPEX structure, and target CF at that site. It is not a universal rule.
No rule of thumb can substitute for this analysis because the optimal ratio is site-specific, CF-target-specific, and CAPEX-structure-specific.
The role of BESS: when to add storage vs. just oversizing RE
One of the more counterintuitive findings from the Sebbahi study is that battery storage was not selected in any of the five optimized baseline configurations. The reason: when the electrolyzer can operate flexibly across a wide part-load range, direct load-following of renewable generation is more cost-effective than buffering through a battery. The battery CAPEX (at $273/kWh in the study) adds cost that is not recovered by the additional hydrogen production it enables at moderate CF targets.
Battery storage becomes economic in two scenarios:
High CF targets. When forced to operate at CF ≥ 80–90%, the battery enables the electrolyzer to maintain production through brief generation gaps. At CF = 100%, battery cost dominates LCOH, which is why forcing continuous operation is economically catastrophic at any reasonable RE resource quality.
RFNBO compliance requirements. Under EU Delegated Regulation 2023/1184, from 2030 onward each unit of electricity used for electrolysis must be matched by renewable generation in the same hour. Battery storage becomes a compliance tool in this context: it allows a solar-only or hybrid system to discharge stored renewable electricity during hours when instantaneous RE output would otherwise fall short.
Pre-FEED sizing heuristics
The following are engineering estimates for pre-FEED scoping only, not optimized results. Replace with site-specific PSO runs at the next stage.
| RE Configuration | Typical achievable CF range | RE oversizing ratio (RE:Elz nameplate) | BESS required? |
|---|---|---|---|
| Solar-only, good MENA site | 25–32% | 2.0–3.0× | No (moderate CF); Yes (RFNBO / high CF) |
| Wind-only, Atlantic coast (≥6.5 m/s) | 38–48% (est.) | 1.5–2.5× | No (moderate CF) |
| Hybrid PV+Wind, complementary resource | 42–55% | 2.0–3.0× (combined) | No (moderate CF); Yes (RFNBO) |
| Hybrid PV+Wind+BESS | 55–75% | 2.5–4.0× | Yes (by definition) |
The RE oversizing ratio, meaning total installed RE capacity relative to electrolyzer nameplate, is the practical sizing handle at pre-FEED. A ratio below 1.5× produces insufficient generation hours to support economic operation. A ratio above 4× typically indicates either excessive curtailment or an unrealistic CF target. The sweet spot at sites with good complementary resources is 2.0–2.5× total RE to electrolyzer nameplate.
6. Configuration Decision Table
| RE Configuration | Typical CF range | LCOH impact vs. hybrid | Stack degradation | RFNBO compliance | Use when |
|---|---|---|---|---|---|
| Solar-only | 25–32% | +$0.5–1.0/kg | Low cycling; fewer thermal events | Needs BESS from 2030 onward | Wind resource <4 m/s; land constraints rule out wind; domestic/non-export market |
| Wind-only | 35–48%* | +$0.2–0.7/kg | Moderate; better overnight utilization | Easier (24h availability) | Exceptional offshore or coastal wind; solar resource weak; visual/land constraints on PV |
| Hybrid PV + Wind | 42–55% | Baseline / lowest LCOH | Longer run hours; lower cycling penalty per unit H₂ | Feasible without BESS at moderate CF; BESS needed for high CF + RFNBO | Both resources qualify (wind ≥5 m/s AND GHI ≥220 W/m²); LCOH-minimization objective; EU export |
| Hybrid + BESS | 55–75% | +$0.3–0.8/kg vs. no-BESS hybrid | Fewer cycles; near-continuous operation | Full compliance achievable | RFNBO export requiring high compliance rate; contracted supply requiring firm output |
| Grid-connected hybrid | 60–90% | Depends on power purchase cost | Low cycling | Requires PPA from certified RE; additionality rules apply | Industrial cluster with access to certified green grid power; domestic ammonia/fertilizer market |
Wind-only CF estimates are engineering literature ranges, not direct Sebbahi paper results. Actual values are site- and turbine-specific.
Conclusion: The Pre-FEED Developer's First Question
The hierarchy of decisions in a green hydrogen project runs in this order, from highest to lowest LCOH leverage:
1. What is my achievable electrolyzer capacity factor? This is determined by the renewable energy configuration and the quality of both resources at your specific site. It is the dominant LCOH driver, outweighing electrolyzer technology selection, CAPEX negotiation, and financing structure in most pre-2030 project economics.
2. How do I maximize that CF without over-investing in RE? The answer is PSO-class optimization against your site's actual hourly resource profiles, with complementarity between solar and wind as the first thing to screen for.
3. Only then: which electrolyzer technology? AWE, PEM, and SOEC choices matter for stack lifetime, dynamic response, purity specifications, and water management, but they move LCOH by fractions of a dollar per kilogram, not dollars per kilogram. If you are choosing between a PEM at 28% CF and AWE at 28% CF, you are optimizing the second-order problem. If you are choosing between solar-only at 28% CF and hybrid at 51% CF, you are solving the right problem.
The Dakhla result crystallizes this. The best LCOH in a five-site study, $3.18/kg, came not from the site with the highest solar resource (Benguerir, 242.8 W/m²), nor from exceptional land availability, nor from a technology advantage. It came from Dakhla's unique combination of high solar irradiance (257.4 W/m²) and Morocco's strongest average wind resource (7.01 m/s), producing a temporal complementarity that drives electrolyzer CF to 50.85%, nearly double the solar-only sites.
At pre-FEED, the single most important piece of analysis is a resource complementarity screen: not just "is there wind?" and "is there sun?" but "do these two resources fill each other's gaps across the 8,760 hours of the year?" The answer to that question sets the ceiling on your project economics. Everything else is refinement.
For the electrolyzer technology selection question (AWE vs. PEM vs. SOEC at utility scale), see our companion article: AWE vs. PEM: A Utility-Scale Engineer's Comparison. That analysis assumes you have already answered the CF question first.
Engineering Confidence Notes
High confidence: Dakhla CF of 50.85%, LCOH of $3.18/kg, and cost structure breakdown (wind 38.1%, PV 16.7%, electrolyzer 20.4%): directly from Sebbahi et al., Journal of Power Sources 677 (2026) 240015, peer-reviewed.
High confidence: Solar-only CF range 27–29% at Benguerir, Laayoune, El Jadida, Tan-Tan: directly from PSO optimization results in the same paper. LCOH values for all five sites: directly from Table 6 and Section 4.2.
High confidence: LCOH reduction of 39.6–69.5% from CF relaxation (100% → 70%): directly from Section 4.5 and abstract. Electrolyzer CAPEX sensitivity <±0.5 $/kg: from Section 4.6 and Figure 8. Battery CAPEX sensitivity up to ±4.27 $/kg: from Section 4.6.
Medium confidence (engineering estimate): LCOH sensitivity of ~$1.00–1.90/kg per 10 pp CF gain in the 100 MW worked example: computed from a simplified annualized-cost model (capital recovery factor at 5% over 25 years, flat $350M CAPEX, 2.5% OPEX, no stack replacement). Actual values at utility scale will depend on CAPEX structure, WACC, and specific technology choices. Use for directional scoping only.
Medium confidence (engineering estimate): Wind-only CF at Moroccan Atlantic-coast sites (38–48%): literature range estimate based on mean wind speed analysis and standard Weibull power production modeling. No wind-only optimization case was published in the paper; the optimizer did not select wind-only at any site.
Medium confidence (engineering estimate): Pre-FEED sizing heuristics in Table 3 (RE oversizing ratios, CF ranges by configuration): derived from the Sebbahi paper results combined with IRENA benchmark ranges. Site-specific optimization will deviate from these ranges. Do not use for detailed engineering.
Lower confidence (engineering judgment): Complementarity index (Pearson-r) value for Dakhla: the Sebbahi paper characterizes PV-wind complementarity qualitatively through diurnal profiles but does not report a numeric Pearson-r value in the published text. The complementarity index formula cited here is from the Hyzen T-01 Methodology v2.0, applied to the same resource profiles. A numeric C value for Dakhla would require direct computation from the ERA5/CAMS hourly data.
References
[1] Sebbahi, S., Tribiche, A., Alaoui Belghiti, A., Laasri, S., Ghennioui, A., Rachidi, S., Hajjaji, A. (2026). "Modeling and techno-economic assessment of a 20 kW alkaline green hydrogen micro-pilot powered by hybrid solar-wind systems in Morocco." Journal of Power Sources, 677, 240015. https://doi.org/10.1016/j.jpowsour.2026.240015
[2] Hyzen Energy. (2026). T-01 Renewable Energy Profile Engine: Methodology v2.0. Internal technical document. Defines the complementarity index C = Pearson_r(P_PV_filtered, P_wind_filtered) and interpretation bands used in this article.
[3] IRENA. (2024). Renewable Power Generation Costs 2023. International Renewable Energy Agency, Abu Dhabi. Capital cost benchmarks for PV, wind, and storage cited for context in sizing heuristics.
[4] European Commission. (2023). Commission Delegated Regulation (EU) 2023/1184: RFNBO temporal correlation and additionality rules. https://eur-lex.europa.eu/legal-content/EN/TXT/?uri=CELEX:32023R1184