
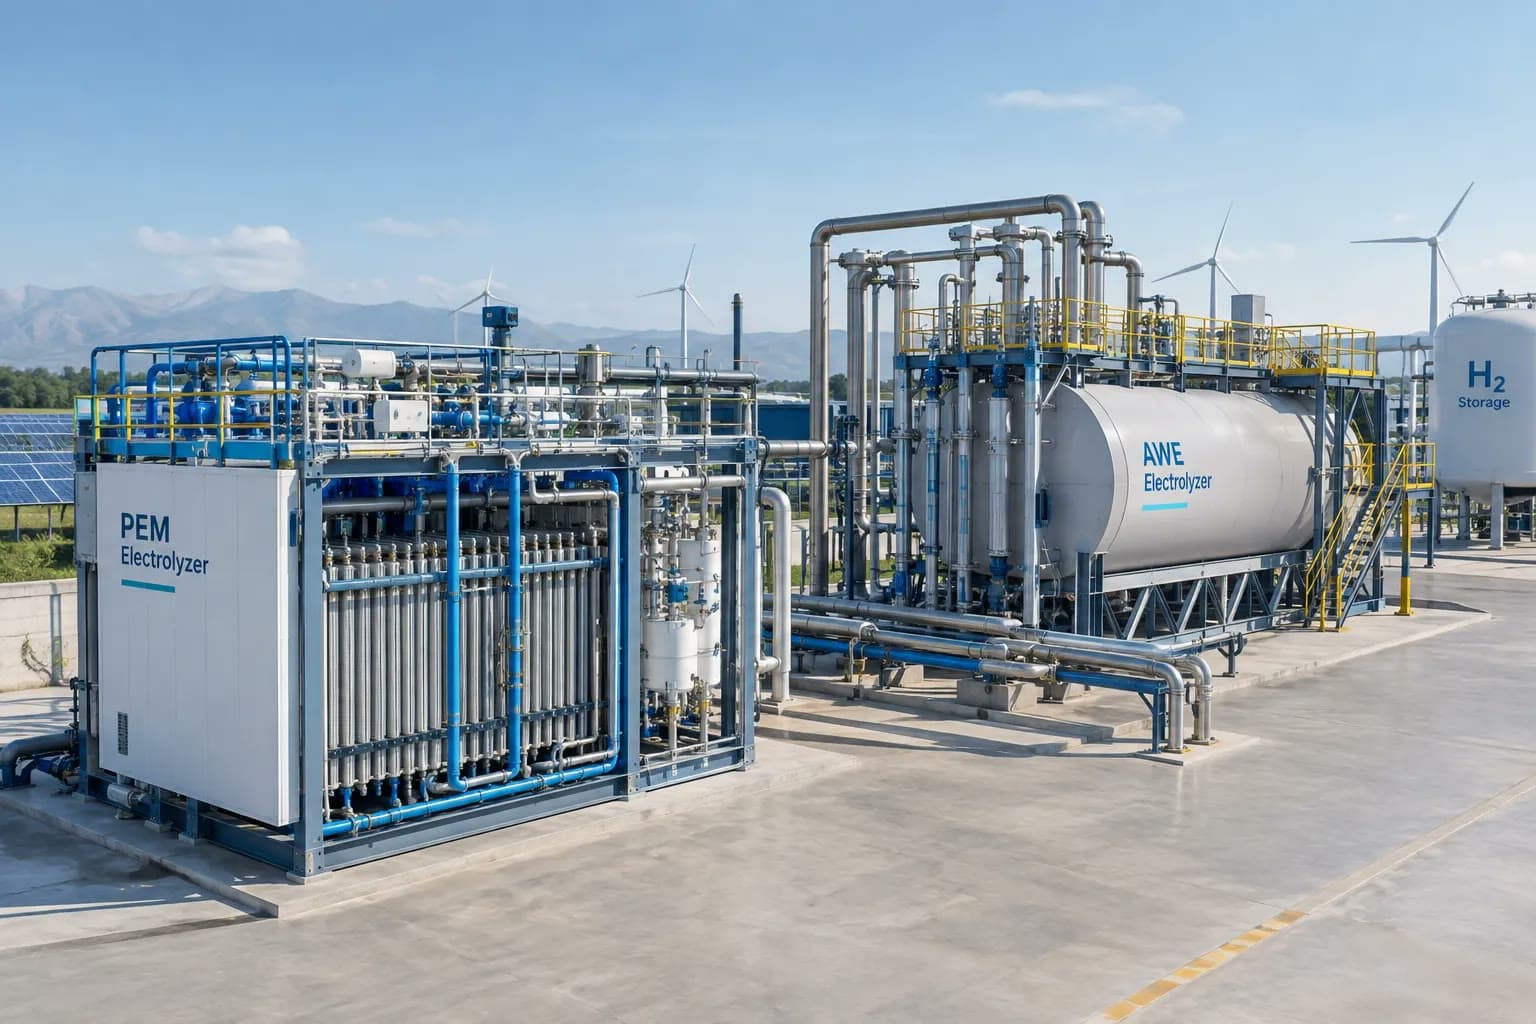
Most technology comparison articles for green hydrogen electrolysis stop at efficiency specs and CAPEX/kW. That gets the decision wrong about 40% of the time.
The choice between alkaline (AWE) and proton exchange membrane (PEM) electrolysis at utility scale is a capital allocation problem. Get four numbers right, CAPEX/kW, stack lifetime, lifecycle-average specific energy consumption, and your actual capacity factor, and the technology choice follows. Rely on vendor BOL spec sheets alone and you will misprice mid-life stack replacements, undercount iridium procurement risk, and miss the compliance exposure that AWE's cold-start penalty creates under RFNBO rules.
This article works through the decision at each scale threshold: 50 MW, 200 MW, and 500 MW.
The Short Answer
AWE wins at scale - most of the time. At 200 MW and above, AWE has lower CAPEX, a proven supply chain, and better stack replacement economics for typical renewable duty cycles. PEM earns its premium in three specific situations: solar-dominant projects where ramp flexibility recovers lost production hours, applications where native output pressure eliminates a compression stage, and EU RFNBO-certified projects where AWE's cold-start penalty creates compliance exposure.
Side-by-Side Specification Comparison
| Parameter | AWE | PEM | Notes |
|---|---|---|---|
| System efficiency (LHV) | 60–70% | 65–75% | Converge at part-load (~65% at 40–50% load) |
| Specific energy consumption (BOL) | 47–55 kWh/kg | 44–52 kWh/kg | Compare lifecycle-average, not BOL, advantage narrows with degradation |
| Rated current density | 2,000–4,500 A/m² | 15,000–25,000 A/m² | PEM stacks are physically smaller for the same MW output |
| Cold-start time | ~50 min | ~5 min | AWE loses production during every ramp-from-zero event |
| Ramp rate | 10%/min | 100%/min | PEM tracks solar transients in real time; AWE cannot |
| Minimum load (turndown) | 10–20% | 5–10% | AWE shuts off during low-irradiance hours PEM can still run |
| Overload capability | Nameplate limit | Up to 160% rated | PEM can absorb renewable peaks above nameplate |
| Stack lifetime | ~80,000 h | 60,000–100,000 h | Wide PEM range is vendor-dependent; low-cycling duty pushes toward 100,000 h |
| Degradation rate | 0.12%/1,000 op. h | 0.20%/1,000 op. h | Both expressed as V_cell increase |
| Stack cost (% of system) | 40–60% | 40–60% | Stack replacement is the largest mid-life capital event for both |
| CAPEX (>100 MW installed) | $650–780/kW | $910–1,170/kW | System cost + 1.3× install factor + 10% contingency |
| CAPEX (10–100 MW installed) | $845–910/kW | $1,105–1,300/kW | AWE advantage widens below 10 MW |
| OPEX | 2.5%/yr of CAPEX | 3.0%/yr of CAPEX | PEM's higher OPEX reflects more frequent membrane/catalyst servicing |
| H₂ output pressure | 1–30 bar (pressurized AWE) | 30–80 bar (native) | PEM eliminates LP compressor stage in many applications |
| Water quality requirement | >0.1 MΩ·cm | >1.0 MΩ·cm | PEM adds ~$15–25/kW to water treatment CAPEX |
| Technology readiness (GW-scale) | Multiple GW deployed | <1 GW at >100 MW units | AWE has 100+ MW single-train references; PEM largest trains ~20–50 MW |
| Supply chain risk | Low | Iridium-constrained | ~1–2 g Ir/kW; global iridium supply ~7–8 t/yr, a real procurement constraint at >100 MW |
CAPEX figures are 2025–2026 benchmarks, electrolyzer system only, before installation. Both technologies are on steep cost-reduction trajectories: AWE targeting $250–350/kW by 2030, PEM $400–500/kW.
Scale-by-Scale Decision
50 MW - It Depends on Your Renewable Profile
At 50 MW both technologies are commercially available. The decision turns on how variable your power source is.
If you're solar-only with no BESS: PEM's ramp rate and low minimum load recover 5–8% of annual generation hours that AWE wastes in warm-up sequences. At $4.00/kg LCOH, that's $0.20–0.30/kg, enough to partially offset PEM's $150–200/kW CAPEX premium. Model it explicitly; the break-even is tight.
If you're wind-dominant or hybrid: AWE's cold starts are manageable. Its CAPEX advantage is clear. Default to AWE.
RFNBO target (EU export): AWE needs BESS to bridge the compliance gap created by cold starts and minimum load. BESS adds $15–25/kW but recovers the compliance hours. Model AWE + BESS as a combined system, not AWE alone.
The CAPEX premium for PEM at 50 MW ($150–200/kW × 50,000 kW = $7.5–10M additional) adds approximately $0.08–0.12/kg over a 25-year project at 8% WACC. PEM's flexibility benefit for a pure solar project is worth ~$0.10–0.20/kg. The lines cross close together, site-specific modeling is required.
200 MW - AWE's Structural Advantage Becomes Decisive
Two things change at 200 MW: supply chain risk and stack replacement economics.
Supply chain: AWE vendors (Nel, Thyssenkrupp Nucera, John Cockerill) have 200 MW projects in their delivery pipelines with standard warranty terms. A 200 MW PEM plant requires 200–400 kg of iridium, 3–5% of global annual supply. That is a real procurement constraint, not a theoretical one.
Stack replacement math: Stack replacement accounts for 40–60% of system CAPEX. The number of replacements over a 25-year project life is:
Replacements = ⌊(Project years × Annual operating hours) / Stack lifetime⌋
At 4,000 h/yr (wind-dominant hybrid):
- AWE at 80,000 h → 1 replacement
- PEM at 60,000 h → 1 replacement (marginal gap only)
At 6,000 h/yr (grid-connected or curtailment-backed):
- AWE at 80,000 h → 1 replacement
- PEM at 60,000 h → 2 replacements - approximately $60M in additional mid-life CAPEX at 200 MW scale, adding $0.15–0.20/kg to LCOH
Verdict at 200 MW: Default to AWE unless you can demonstrate (a) the renewable profile is so peaky that AWE wastes more than 10% of annual hours, or (b) native output pressure eliminates a compression stage worth more than $15/kW. These conditions exist, they should be proven, not assumed.
500 MW - AWE Baseload, PEM as a Flexible Layer
At 500 MW, no single PEM vendor has a continuous manufacturing line capable of full project delivery on a standard timeline with warranty coverage as of 2026. Pure PEM is not a bankable choice for FID at this scale today.
The more important design question is whether to run pure AWE or a hybrid AWE + PEM architecture:
- 400 MW AWE covers baseload at low cost, high stack lifetime, stable LCOH
- 100 MW PEM layer absorbs renewable peaks above AWE's nameplate, turns down to 5% during low-resource events, and handles RFNBO marginal hours
This hybrid approach costs more upfront but captures production value that pure AWE leaves on the table. Whether the economics close depends on your 8,760-hour renewable profile.
A second benefit at 500 MW: with 40–50 AWE stacks, staggered replacement becomes viable, replacing 20% of stacks per year rather than all stacks in a single capital event. This smooths the cash flow profile significantly and is standard design practice at this scale.
Verdict at 500 MW: AWE baseload train (400–450 MW) + PEM flexible layer (50–100 MW) as the starting position. Pure AWE if budget is the binding constraint. Pure PEM, not recommended before 2027–2028.
The Four Numbers That Actually Drive the Decision
Most pre-FEED models use CAPEX/kW and stop there. That accounts for roughly 40% of the story.
1. Annual Capacity Factor
The dominant lever. A 10 percentage-point change in capacity factor shifts LCOH by $0.30–0.60/kg. This is where your renewable design and dispatch strategy live, 4–6× more impactful than the technology arbitrage between AWE and PEM.
2. Stack Replacement Count
High impact at more than 5,000 operating hours per year. One additional replacement at 200 MW scale is approximately $60M in mid-life CAPEX. Model this explicitly against your actual operating hour forecast, not a calendar assumption.
3. CAPEX/kW Premium
The number everyone starts with. Real, but only ~$0.06–0.12/kg impact on LCOH at greater than 100 MW, not decisive on its own, and always outweighed by capacity factor and replacement count at scale.
4. Lifecycle-Average Specific Energy Consumption
Not BOL-rated SEC. Degradation increases energy consumption by 10–16% over a stack's life. PEM's efficiency edge at rated conditions largely disappears when averaged across the full degradation cycle. Do not let BOL spec sheets drive your technology selection.
What to Do With This at Pre-FEED
Step 1: Pull your 8,760-hour profile. Count cold-start events (ramp from 0 to above minimum load), hours below AWE's minimum load threshold, and peak-to-nameplate ratio. If cold starts exceed 500/year and sub-minimum hours exceed 1,000/year, PEM or BESS warrants explicit modeling. To screen a candidate site's solar and wind resource first, use the free HYZEN Site Screener.
Step 2: Build the lifecycle capital model, not just CAPEX. Year 0 equipment cost + mid-life stack replacements (at your actual operating hours) + annual OPEX, all discounted to NPV. A $200/kW PEM premium at 200 MW can reverse when a second stack replacement enters the model.
Step 3: Run sensitivity on the three most uncertain inputs: Stack lifetime (PEM range is 60,000–100,000 h: a significant spread), degradation under dynamic load (faster than flat-current specs suggest), and future stack replacement cost (falling, but on an uncertain trajectory).
Step 4: Use this decision table as a starting position:
| Scale | Renewable Profile | RFNBO? | Starting Position |
|---|---|---|---|
| 50 MW | Solar-only | No | PEM |
| 50 MW | Wind or Hybrid | No | AWE |
| 50 MW | Any | Yes | AWE + BESS (model explicitly) |
| 200 MW | Any | No | AWE |
| 200 MW | Solar-dominant | Yes | AWE + BESS |
| 200 MW | Wind/Hybrid | Yes | AWE |
| 500 MW | Any | Any | AWE (400 MW) + PEM layer (100 MW) |
Step 5: Demand lifecycle data from vendors, not BOL specs. Ask for: demonstrated stack lifetime at your target current density, degradation rate under dynamic load, stack replacement cost as a percentage of initial system cost, and for PEM, iridium loading in g/kW with expected end-of-life recovery value. Any vendor who cannot provide items 2 and 3 contractually is transferring their risk onto your balance sheet.
Bottom Line
AWE is the bankable default at scale. PEM earns its premium in well-defined scenarios that should be modeled, not assumed. The most important number in your technology decision is not the vendor's efficiency spec, it is your electrolyzer's actual annual capacity factor, calculated against your real renewable profile. Get that right and the technology choice is usually straightforward.
Want to test this on your own project? Try the Site Screener or request early access to HYZEN. More in Electrolyzer Design & Sizing.
The analysis in this article draws on the engineering framework published in: Sebbahi, S. et al., "Modeling and techno-economic assessment of a 20 kW alkaline green hydrogen micro-pilot powered by hybrid solar-wind systems in Morocco," Journal of Power Sources 677 (2026) 240015.
Engineering confidence notes: AWE electrochemical parameters (degradation rates, ramp rates, cold-start times) are validated against published literature and Hyzen's calibrated model. PEM stack lifetime upper range (100,000 h) is vendor-dependent with limited public field data at utility scale. Iridium supply figures are industry estimates subject to recycling trajectory uncertainty.