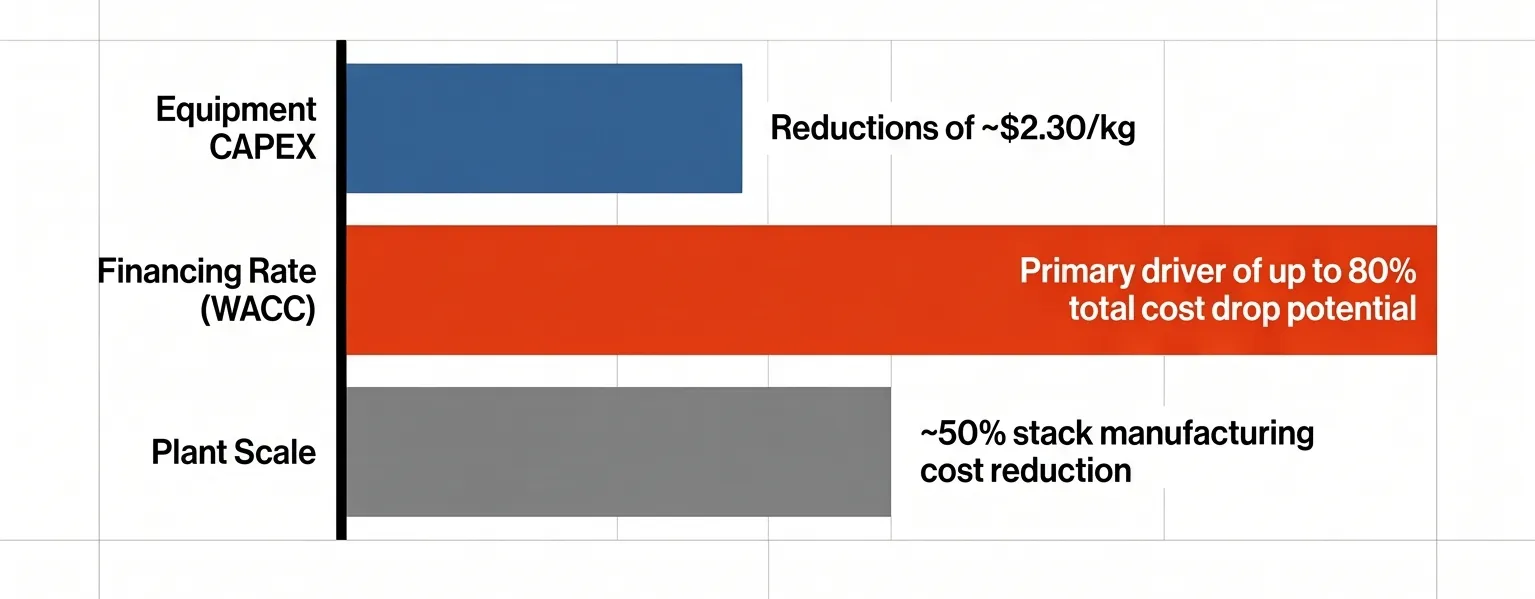
Most green hydrogen project teams spend months negotiating electrolyzer price per kilowatt. Few spend the same energy negotiating their weighted average cost of capital (WACC). The data suggests they have the priorities backwards: at commercial scale, financing terms move the levelized cost of hydrogen far more than the electrolyzer's sticker price does.
The Instinct: CAPEX Is the Number You Can See
Electrolyzer CAPEX is concrete. It's a line item in a vendor quote, a number you can benchmark against three other suppliers, a figure your board understands. Discount rate is abstract. It is buried in a financial model, expressed as a percentage that project teams often treat as a fixed input handed down by finance rather than something to actively manage.
That instinct is understandable. It's also, at scale, misplaced.
What the Sensitivity Data Actually Shows
Lazard's Levelized Cost of Hydrogen Analysis (Version 2.0, October 2021), built with Roland Berger and drawing on cost data from the Fuel Cell and Hydrogen Energy Association, NREL, and Pacific Northwest National Laboratory, publishes exactly this sensitivity, sized across 1 MW, 20 MW, and 100 MW alkaline electrolyzer plants at fixed electricity cost.
At a 100 MW plant with electricity at $40/MWh, moving electrolyzer CAPEX across its full modeled range ($510/kW to $760/kW, a 49% swing) moves LCOH from $3.23/kg to $3.28/kg. That is a 1.5% change in LCOH for a 49% change in CAPEX.
At 20 MW, the same relative CAPEX swing (roughly 52%, from $690/kW to $1,050/kW) moves LCOH by about 2.4%. At 1 MW, a similar swing (from $1,180/kW to $1,770/kW) moves LCOH by roughly 11.5%.
| Plant scale | CAPEX range modeled | CAPEX swing | LCOH movement |
|---|---|---|---|
| 1 MW | $1,180–$1,770/kW | ~50% | ~11.5% |
| 20 MW | $690–$1,050/kW | ~52% | ~2.4% |
| 100 MW | $510–$760/kW | ~49% | ~1.5% |
Source: Lazard LCOH Analysis v2.0 (October 2021), with Roland Berger.
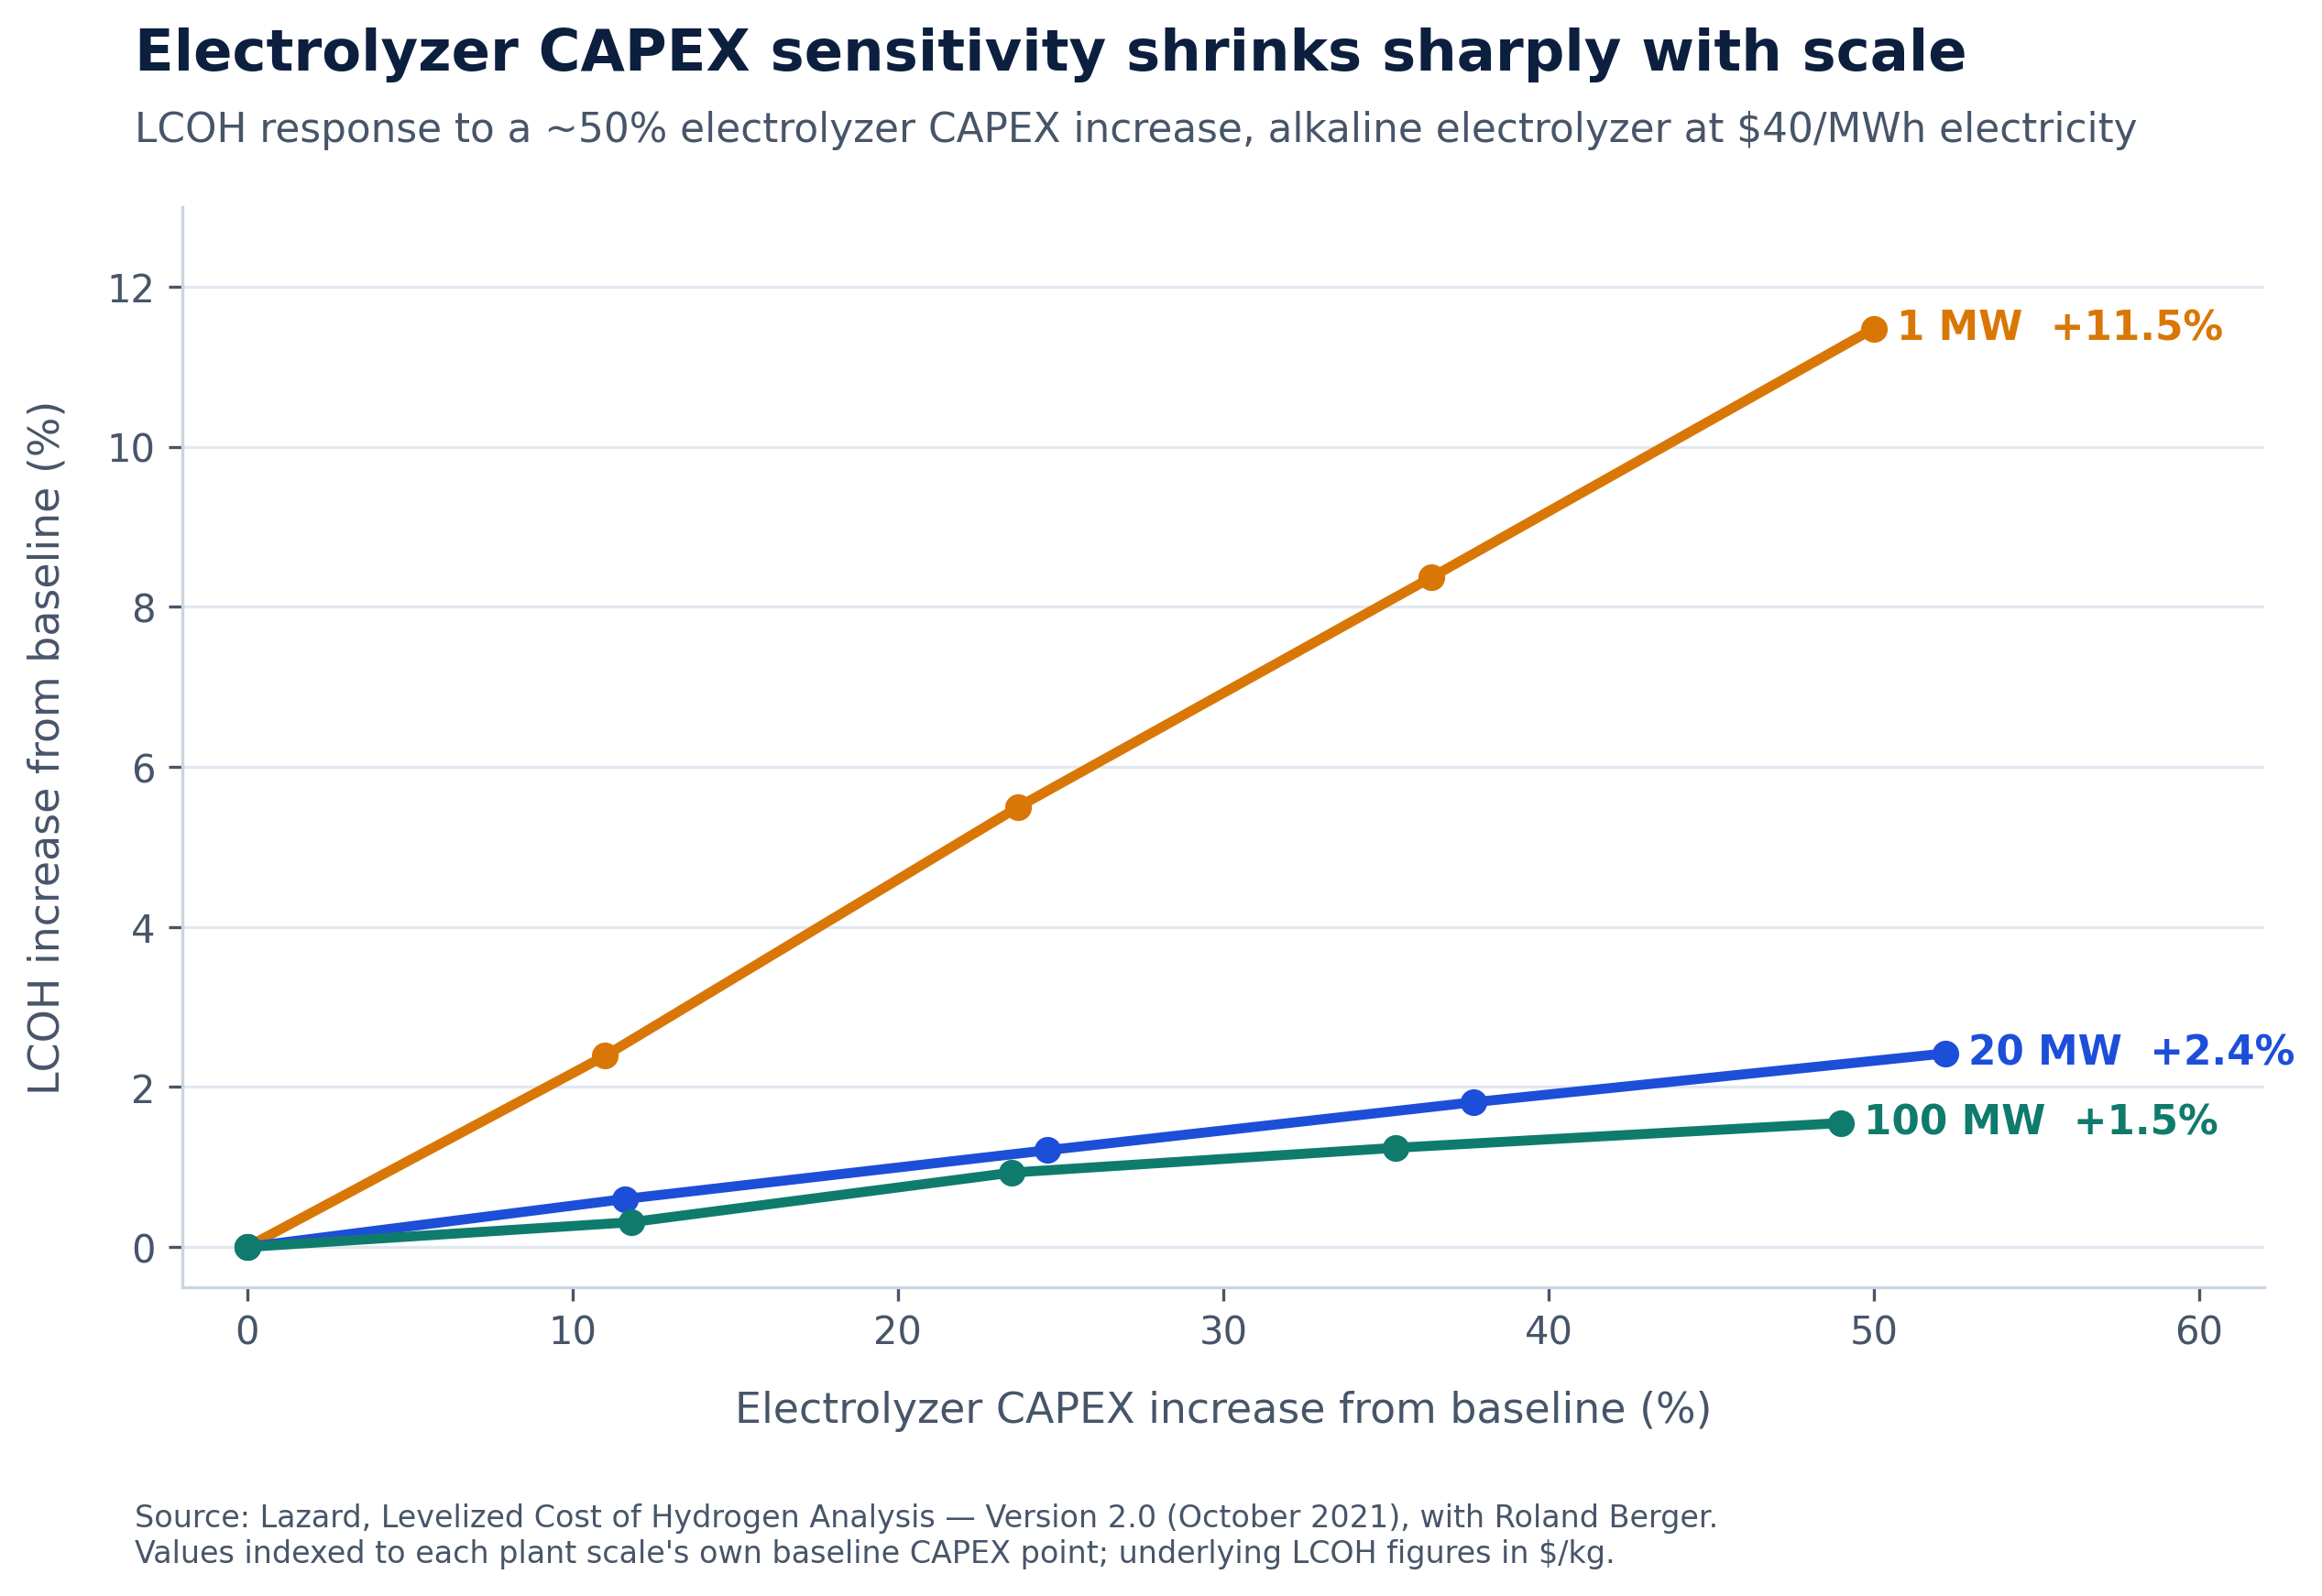
The pattern is consistent: CAPEX sensitivity shrinks sharply as scale increases. At utility scale, the electrolyzer's per-kW price is a comparatively minor lever.
This is corroborated at the smaller end by Sebbahi et al. (Journal of Power Sources, 2026), which found battery CAPEX, PV CAPEX, and discount rate to be the dominant LCOH cost drivers in a hybrid solar-wind system, with electrolyzer CAPEX comparatively less influential even at 20 kW scale.
The Discount Rate Lever
Contrast that with financing cost. A 2025 ANDRITZ whitepaper on Power-to-X economics models a European electrolysis plant at 4,000 full-load hours/year and 40 €/MWh electricity, and tests a 3-percentage-point difference in project interest rate (7% for a low-execution-risk project versus 10% for a high-risk one, based on a World Bank Group-cited 2–5% project execution risk premium range).
That 3-point difference alone produced an 8% swing in LCOH.
To close that same gap through technology instead, the higher-risk project would need roughly an 18% electrolyzer efficiency advantage or a 16% CAPEX advantage over the lower-risk one, improvements well beyond what is realistically available between competing electrolyzer vendors today.
This finding is not isolated:
-
OECD Environment Working Paper No. 227 (Lee & Saygin, 2023) found that green hydrogen financing costs range from roughly 5% to more than 20% depending on country risk and project maturity, meaning two projects using identical electrolyzer technology can land at substantially different LCOH purely because of how they are financed.
-
Agora Energiewende's LCOH methodology independently names discount rate, alongside electricity cost, as one of the two biggest LCOH drivers, ranking it ahead of EPC cost, stack cost, and balance-of-plant.
-
A 2024/2025 Applied Energy study on Australian hydrogen hubs (Griffith University, Rezaei et al.) found that a WACC of 6% (versus higher, more typical rates) was sufficient on its own to bring a Gladstone-region project down to the $3/kg target cost, without requiring aggressive CAPEX assumptions.
The comparison that matters: Negotiating a 15% reduction in electrolyzer CAPEX with your vendor moves LCOH by roughly $0.015/kg at 100 MW scale, interpolating the Lazard sensitivity above. A 3-percentage-point improvement in WACC moves it by multiples of that. These are not the same lever.
Where CAPEX Still Matters
This is not a case for ignoring electrolyzer CAPEX. A 2024 techno-economic sensitivity study on cost-competitiveness (ScienceDirect) found that reaching the aggressive $2/kg LCOH target requires electrolyzer CAPEX reductions on the order of 50%, alongside sub-$20/MWh electricity and utilization above 50%. No financing improvement alone gets you there.
CAPEX matters most in two contexts:
At small scale. Below approximately 20 MW, the sensitivity numbers above show CAPEX still moves the needle meaningfully. The fixed cost structure of small plants means equipment price carries more weight.
When chasing frontier cost targets. Pushing from $3/kg toward $2/kg or below requires both structural financing improvement and aggressive CAPEX reduction. Neither alone is sufficient at that level of ambition.
The practical takeaway is sequencing, not substitution: at commercial scale, discount rate is usually the bigger near-term lever; CAPEX reduction becomes decisive again as the industry pushes toward sub-$2/kg costs.
What This Means for Project Development
If WACC is doing more work than CAPEX at your project's scale, the actions that lower LCOH fastest often are not procurement actions at all.
Engage an experienced EPC early, before FID, not after. ANDRITZ's own risk premium range (2–5%) is driven largely by EPC track record and execution structure. A lump-sum turnkey contract with a proven contractor sits at the low end of that range; a cost-plus arrangement with an unproven consortium sits at the high end. The WACC difference between these two positions can exceed $0.20/kg.
Secure long-term offtake and regulatory clarity before financing close. Lenders price uncertainty directly into the discount rate. A secured offtake agreement is a WACC lever, not just a revenue lever. It de-risks the cash flow profile in the eyes of project finance banks and reduces the required risk premium accordingly.
Model discount rate sensitivity with the same rigor you apply to CAPEX quotes. A Monte Carlo sensitivity run across WACC scenarios, not just a single point estimate, shows a project's actual cost exposure and where the marginal dollar of risk mitigation buys the most LCOH improvement. Single-point WACC assumptions in feasibility studies routinely understate financing cost risk.
Don't over-negotiate electrolyzer price at the expense of bankability. A cheaper electrolyzer from a less-proven vendor can raise perceived execution risk enough to erase the CAPEX saving through a higher discount rate. The cheapest equipment and the lowest LCOH are not always the same outcome.
The Sensitivity Hierarchy at 100 MW+
For a commercial-scale green hydrogen project, the LCOH sensitivity hierarchy, from highest to lowest leverage, typically runs:
| Driver | LCOH sensitivity | Typical range of impact |
|---|---|---|
| Electrolyzer capacity factor / utilization | Highest | $1.00–2.00+/kg for a 20 pp CF change |
| Electricity cost (RE LCOE) | Very high | $0.50–1.50/kg for a $20/MWh change |
| WACC / discount rate | High | $0.20–0.60/kg for a 3 pp change |
| Electrolyzer CAPEX (at 100 MW+) | Low | ~$0.03/kg for a 30% change |
| Stack replacement timing | Moderate | $0.10–0.25/kg depending on operating hours |
The first two drivers (capacity factor and electricity cost) are covered in detail in our companion articles on hybrid solar-wind system design and AWE vs. PEM technology selection. This article addresses the third: the financing cost that most pre-FEED models treat as a fixed assumption rather than a design variable.
The Bottom Line
Electrolyzer CAPEX is the most visible number in a hydrogen project budget. At utility scale, it is not the most important one.
The project teams that achieve the lowest LCOH are not necessarily the ones with the best vendor relationships or the sharpest procurement negotiations. They are the ones that treat financing structure, EPC selection, and offtake de-risking as engineering decisions, because at 100 MW and above, that is exactly what they are.
Sensitivity modeling across CAPEX, discount rate, and utilization simultaneously (rather than one variable at a time) is where most manual feasibility studies fall short. It is also where the largest gaps between projected and realized LCOH tend to originate.
References
[1] Lazard. Levelized Cost of Hydrogen Analysis: Version 2.0 (October 2021). Produced with Roland Berger; data from Fuel Cell and Hydrogen Energy Association, NREL, and Pacific Northwest National Laboratory.
[2] ANDRITZ. Levelized Cost of Green Hydrogen: The Impact of Engineering and Technology Maturity (2025). Citing World Bank Group, The Cost of Risk: Impacts on Financing Cost and Availability (2025).
[3] Lee, M. & Saygin, D. Financing Cost Impacts on Cost Competitiveness of Green Hydrogen in Emerging and Developing Economies. OECD Environment Working Paper No. 227 (2023).
[4] Agora Energiewende / Agora Industry. Levelised Cost of Hydrogen: Making the Application of the LCOH Concept More Consistent and More Useful.
[5] Rezaei, M. et al. Levelised Cost of Dynamic Green Hydrogen Production: A Case Study for Australia's Hydrogen Hubs. Applied Energy (Griffith University, 2024/2025).
[6] Sebbahi, S. et al. Modeling and Techno-Economic Assessment of a 20 kW Alkaline Green Hydrogen Micro-Pilot Powered by Hybrid Solar-Wind Systems in Morocco. Journal of Power Sources 677 (2026) 240015. https://doi.org/10.1016/j.jpowsour.2026.240015
[7] Cost-Competitiveness of Green Hydrogen and Its Sensitivity to Major Financial and Technical Variables. ScienceDirect (2024).