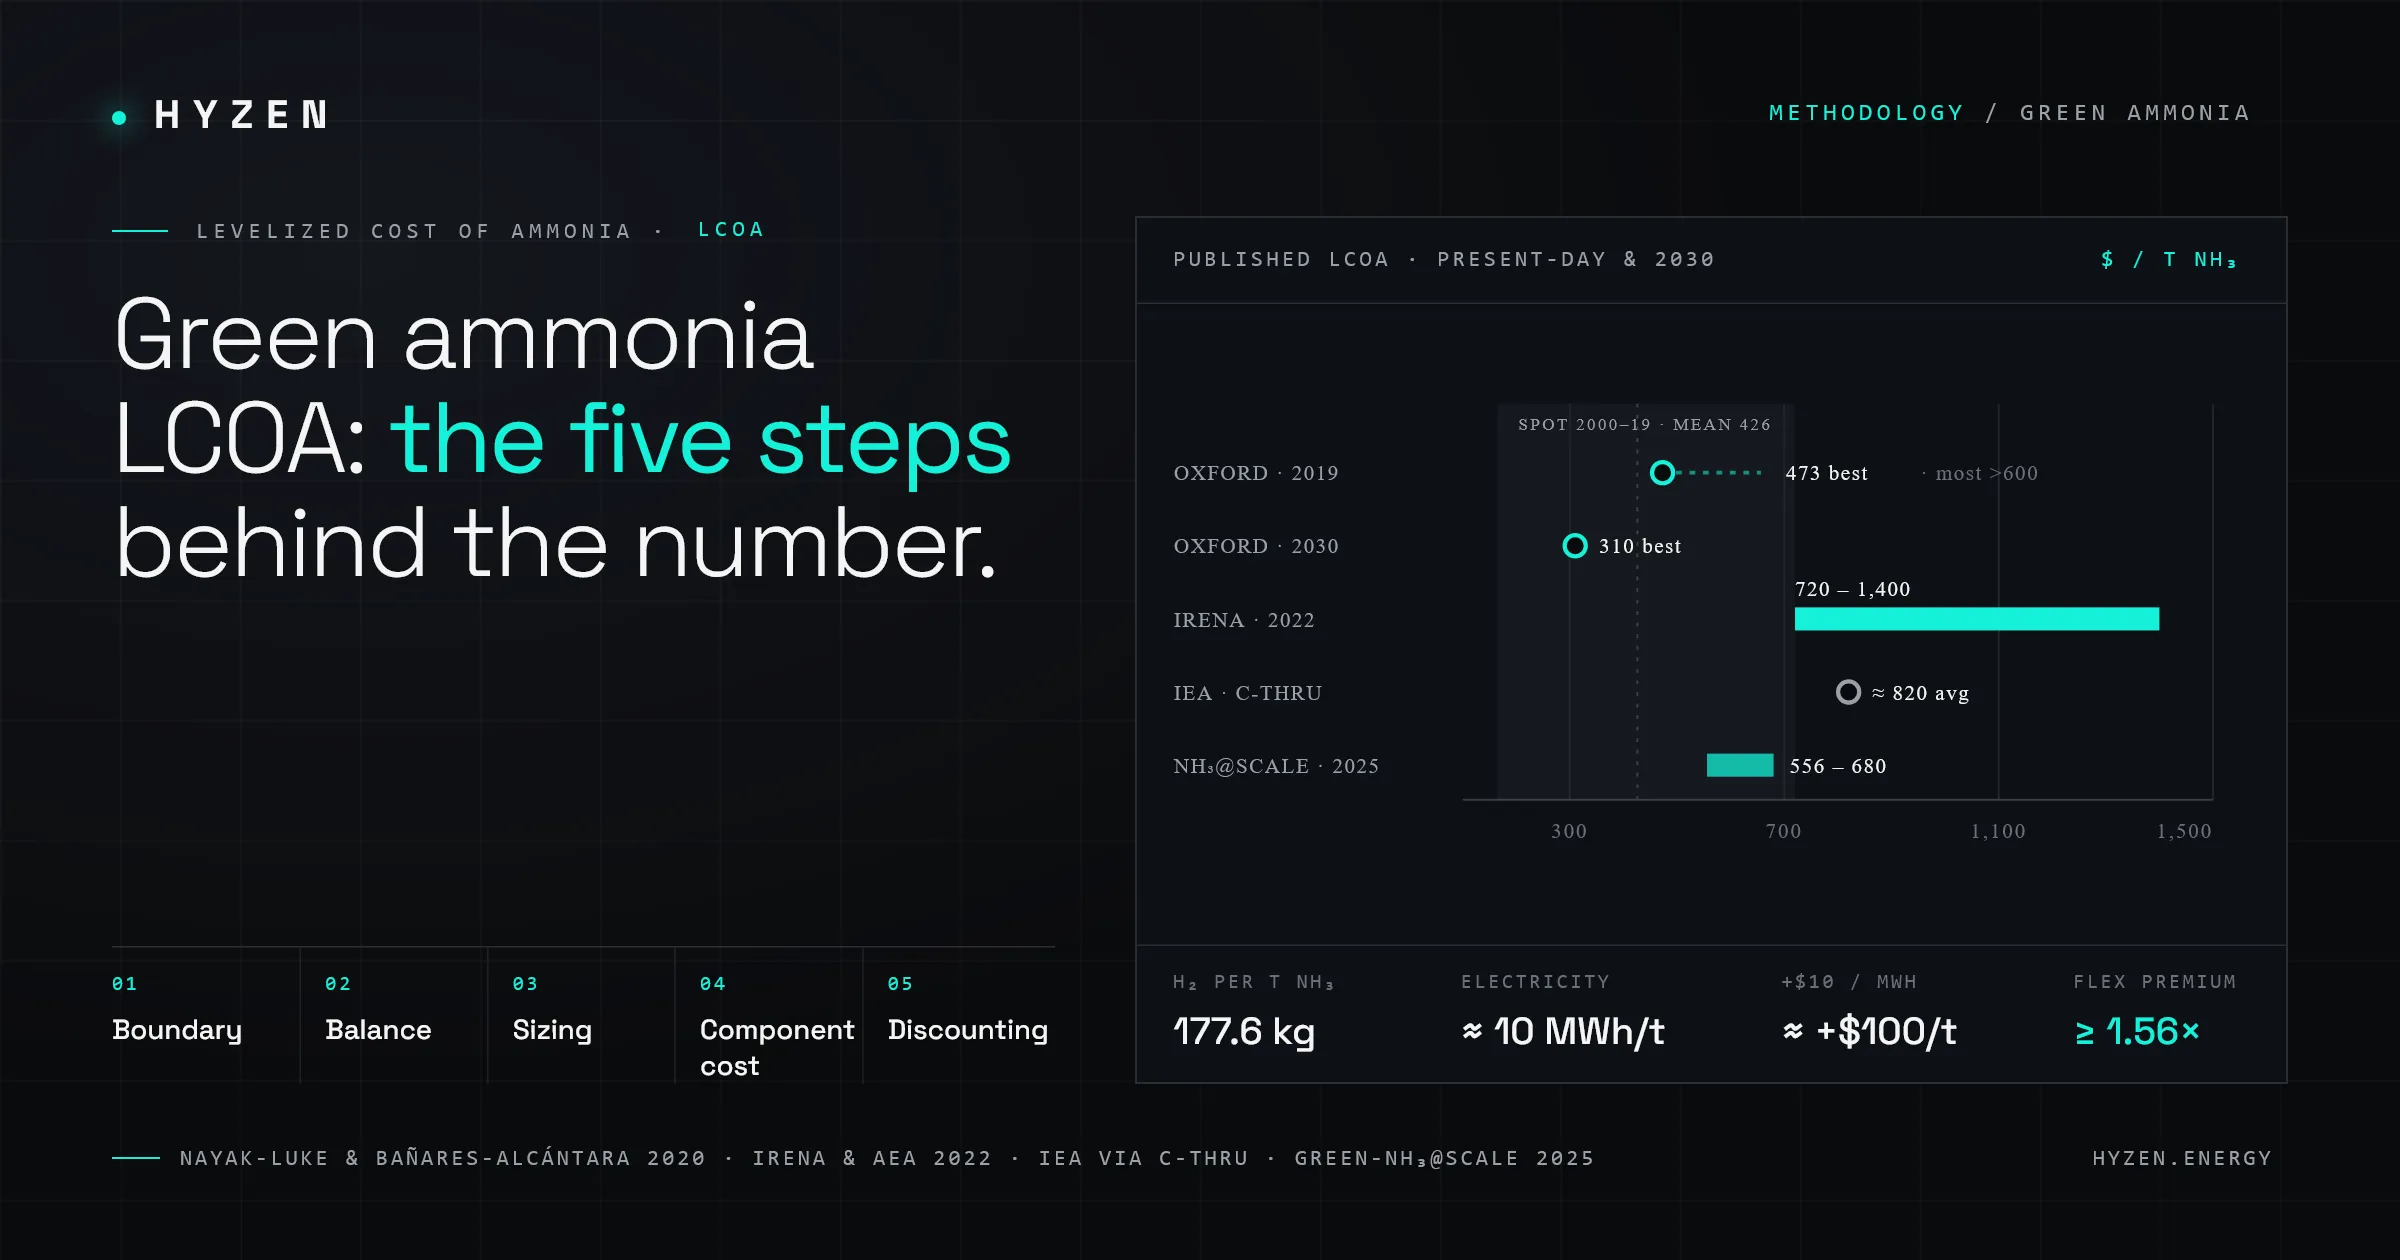
Search for the cost of green ammonia and the figures scatter. One 2019-based study reports $473 per tonne at its best site. IRENA's 2022 outlook puts new plants at $720 to $1,400 per tonne. An IEA roadmap, summarized in a 2022 technical brief, averages around $820 per tonne. All are levelized costs of ammonia (LCOA) for present-day plants.
Part of that spread is site quality. A large part is method. The authors of the 2020 Oxford study warn explicitly that earlier studies used varying assumptions, so comparing them calls for caution.
This post lays out the green ammonia LCOA calculation methodology in five steps, with published numbers to check each step against.
What LCOA Measures
LCOA is the ammonia price at which a project's discounted revenue equals its discounted cost:
LCOA = Σ [ (I_t + O_t) / (1 + r)^t ]  ÷  Σ [ M_t / (1 + r)^t ]      t = 0 … N

I_t  =  capital spending in year t (initial build, stack replacements)
O_t  =  operating cost in year t (O&M, water, purchased power, other)
M_t  =  tonnes of ammonia sold in year t
r    =  discount rate
N    =  project life
Costs and tonnes are both discounted, that is what "levelized" means. The 2020 Oxford study applies the same time-value logic to both the cost side and the mass of ammonia produced.
For constant annual output and a single upfront capital outlay, the formula collapses to:
LCOA = (CAPEX × CRF + fixed O&M) / M  +  variable cost per tonne
CRF  =  r(1+r)^N / ((1+r)^N − 1)
Step 1: Fix the System Boundary
Most disagreement between published numbers starts here.
| Boundary choice | Effect on the result |
|---|---|
| Renewable generation inside or outside | Inside: electricity moves from OPEX to CAPEX |
| Islanded or grid-connected | Islanded needs flexibility; a grid link can import fossil emissions |
| Plant gate or delivered | Shipping is a separate cost layer, up to $45–100/t depending on distance |
| By-product revenue, subsidies, carbon price | Usually excluded; each shifts the answer materially |
On the first row, IRENA notes that many renewable ammonia projects include generation inside the investment, shifting electricity from OPEX to CAPEX. In such integrated plants, the hydrogen, nitrogen, and ammonia processing units can represent under 50% of total project cost. On shipping, IRENA puts it at up to $45–100 per tonne depending on distance, fuel cost, and ship type.
State the boundary in the first line of any LCOA you publish. A number without a stated boundary cannot be compared to anything.
Step 2: Build the Mass and Energy Balance
The synthesis reaction is N₂ + 3H₂ → 2NH₃. From molar masses (2.016, 28.014, and 17.031 g/mol), one tonne of ammonia requires approximately 177.6 kg of hydrogen and 822 kg of nitrogen. Splitting that hydrogen from water takes 9 kg of water per kg of H₂. IRENA gives the same result: about 1.6 tonnes of water per tonne of ammonia.
That 177.6 kg figure gives a useful shortcut: every $1/kg of delivered hydrogen cost adds approximately $178 to each tonne of ammonia.
On energy, an electrolyzer at 52.5 kWh per kg H₂ (approximately 63.5% efficiency on lower heating value) needs about 9.3 MWh per tonne of ammonia for electrolysis alone. Published totals, including air separation and the synthesis loop, cluster near 10 MWh per tonne:
| Source | Reported energy intensity |
|---|---|
| IRENA alkaline-electrolysis case | 36 GJ/t (~10 MWh/t) |
| IEA best-available-technology (via C-THRU, 2022) | 34.4 GJ/t; ~95% of electricity to hydrogen |
| 2026 Aspen Plus model, ~600 kt/yr alkaline plant | 10.28 kWh/kg NH₃ |
| Topsoe SOEC-based estimate | ~7.2 MWh/t; 94% consumed by electrolyzer |
Hydrogen dominates the cost stack. IRENA puts renewable hydrogen at more than 90% of renewable ammonia's production cost. The electricity price rule that follows directly from the energy balance: at ~10 MWh/t, a $10/MWh change in electricity price shifts LCOA by approximately $100/t.
Step 3: Size the Plant Against the Hourly Power Profile
This is the step spreadsheets usually skip, and the most consequential one.
An islanded plant has three coupled design variables. The Oxford model (Nayak-Luke & Bañares-Alcántara, 2020) optimizes: the electrolyzer's rated power, the combined rated power of the Haber-Bosch loop and air separation unit, and the wind share of supply. At each time step it allocates power among the electrolyzer, hydrogen storage, the synthesis loop, and curtailment. It also schedules maintenance in the lowest-power 20-day window of the year.
Variable power forces flexibility, and flexibility costs money. Three levers matter:
Synthesis-loop turndown. IRENA reports the loop can ramp down to 10–30% of nominal capacity, which reduces the hydrogen buffer storage required.
Hydrogen buffer. One day of hydrogen storage costs approximately $35–150 per tonne of ammonia capacity. Salt caverns are cheapest at around $35/t.
Electrolyzer oversizing and curtailment. At the best 2019 sites in the Oxford study, curtailment ran 0.1–13.0% and electrolyzer oversizing above the stoichiometric requirement ran 3–102%, with the upper end concentrated at solar-dependent sites.
The flexibility premium is large and should not be approximated away. The Oxford study found that even at the best locations, LCOA was 56% above an ideal constant-power case in the 2019 scenario, rising to about 76–77% in the 2030 scenario. It concludes explicitly that simple estimates from electrolyzer CAPEX and load factor need a scaling factor of at least 1.56.
Any LCOA derived from annual capacity factors without hourly dispatch modeling is a lower bound. Treat it accordingly.
Step 4: Cost Each Component Over Its Own Life
Cost the electrolyzer (with stack replacements), air separation unit, synthesis loop, compression, hydrogen storage, water treatment, and, if inside the boundary, renewable generation. Which component dominates depends on scale:
- IRENA finds that the synthesis loop dominates capital cost below approximately 10 kt/yr
- At larger scale, the electrolyzer dominates
- Electricity is typically more than half of total cost at large scale
In the Oxford results for the best ten locations by region, electrolyzer CAPEX and OPEX made up 58.2–71.4% of total cost in the 2019 scenario and 44.3–64.7% in the 2030 scenario.
Stack replacement follows operating hours: at higher capacity factors, more replacements occur over the project life. For the full interaction between capacity factor, operating hours, and stack replacement schedule, see our capacity factor optimization analysis. The same logic applies to green ammonia plants: the electrolyzer CF decision is also a stack replacement decision.
Step 5: Discount, and Treat the Rate as a Design Input
Renewable ammonia is capital-intensive by structure. When all assets including generation are built upfront, IRENA notes that the weighted average cost of capital has a profound effect on LCOA. The capital recovery factor (CRF) quantifies this directly over a 20-year project life:
| Discount rate | Capital recovery factor | Annual capital charge per $1,000 installed |
|---|---|---|
| 6% | 0.0872 | $87 |
| 8% | 0.1019 | $102 |
| 10% | 0.1175 | $117 |
| 12% | 0.1339 | $134 |
CRF = r(1+r)^N / ((1+r)^N − 1), N = 20 years. Values calculated.
Going from 6% to 12% raises the annual capital charge by 54%. At 8% and 90% utilization, $1,000 of capital per annual tonne of capacity adds approximately $113 per tonne to LCOA.
The Oxford study used country-specific discount rates and compared them against a multinational's lowest obtainable rates: 3.33% for renewable assets and 7.14% for the ammonia plant. Financing assumptions alone changed which sites appeared viable, not which sites had better resources.
The broader argument for treating discount rate as a design input rather than a fixed assumption is developed in our CAPEX vs. discount rate analysis.
Why Published LCOA Figures Disagree
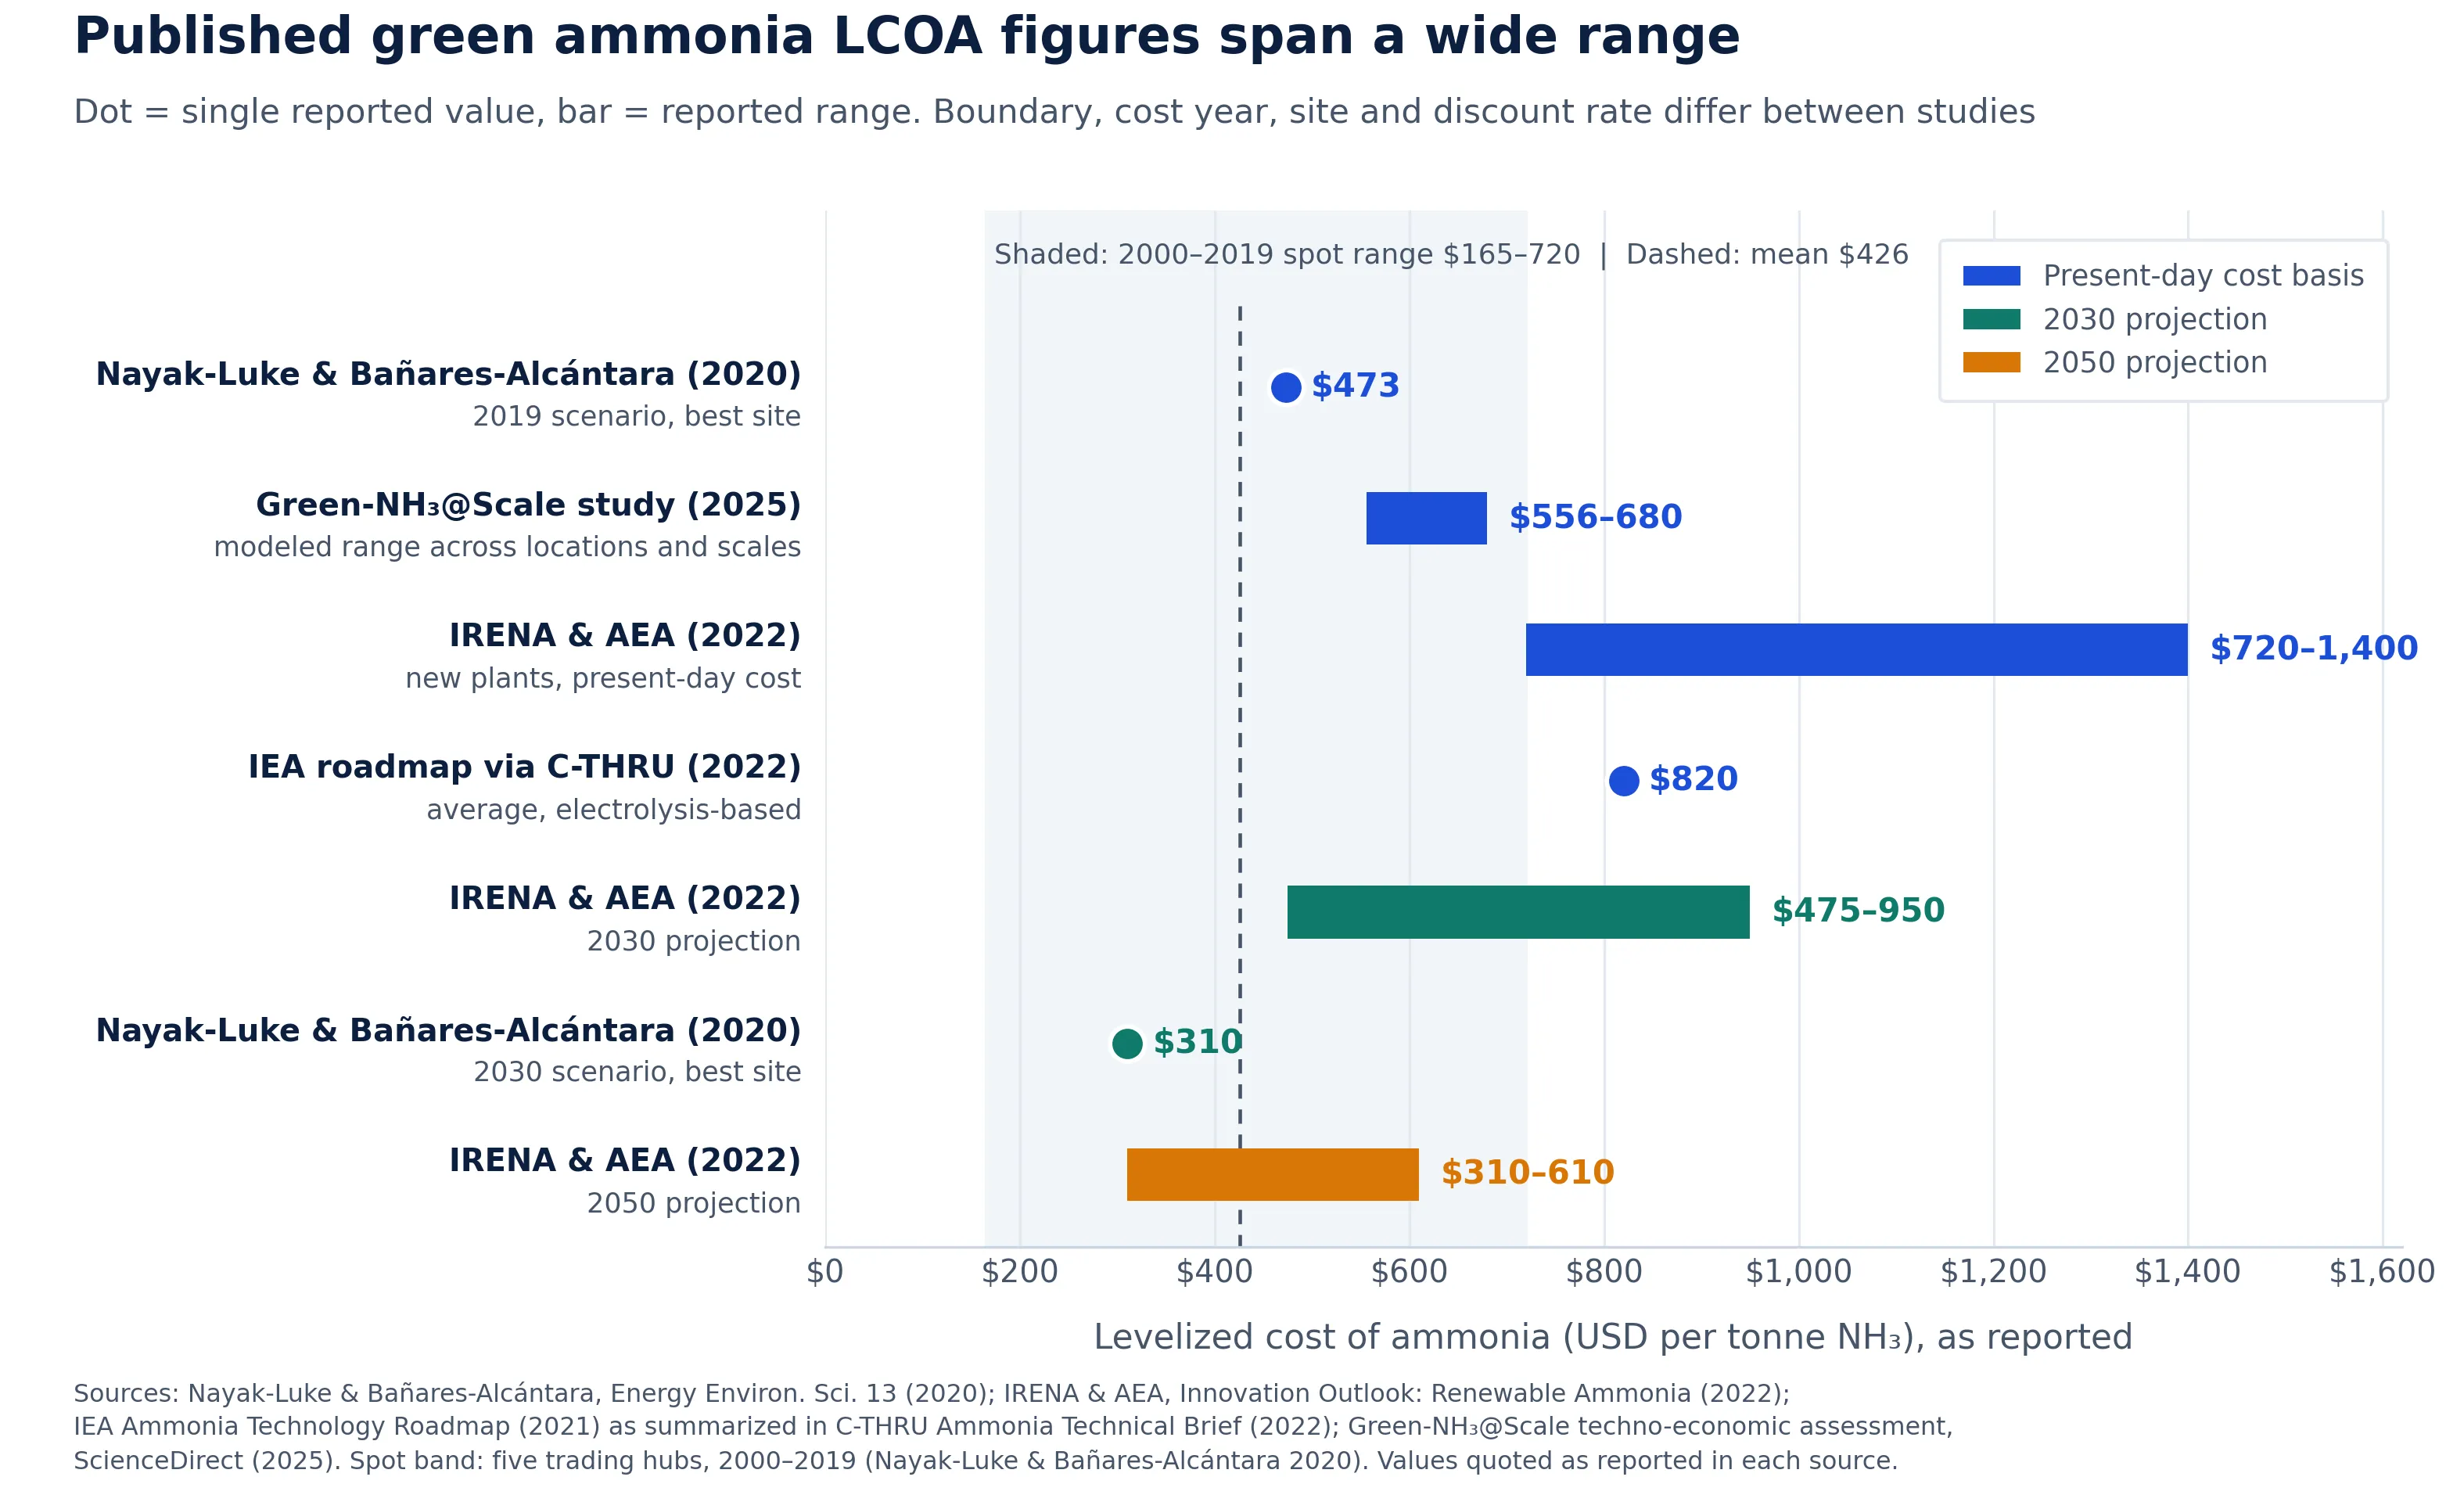
| Study | Cost basis | Reported LCOA | Notes |
|---|---|---|---|
| Nayak-Luke & Bañares-Alcántara, Energy Environ. Sci. (2020) | 2019 scenario | $473/t best site; most sites above $600/t | Islanded, generation included, 534 sites globally |
| Same | 2030 scenario | $310/t best; many sites below $350/t | Same model, projected cost reductions |
| IRENA & AEA (2022) | c. 2020–21 | $720–$1,400/t new plants | Projects often include generation; falls to ~$480/t (2030) and ~$310/t (2050) at best sites |
| IEA roadmap via C-THRU brief (2022) | c. 2021 | ~$820/t average | Secondary summary, verify against IEA original |
| Green-NH₃@Scale, ScienceDirect (2025) | 2025 | $556–$680/t | Aspen Plus, H2A and SAM modeling; blue ammonia reference ~$400/t |
For context: 2000–2019 spot prices across five trading hubs ranged from $165 to $720 per tonne with a mean of $426/t. IRENA estimates a carbon price of approximately $150/tCO₂ would bridge renewable and fossil ammonia at current costs. To convert between $/t and $/GJ, both the Oxford and IRENA figures imply an ammonia heating value near 18.6 GJ/t.
What Moves the Result
| Driver | Published sensitivity | Source |
|---|---|---|
| Electricity price | +$10/MWh ≈ +$100/t (at ~10 MWh/t) | IRENA/AEA 2022 |
| LCOE (islanded, Scotland case) | ±£0.89/MWh ≈ ±£10/t | Nayak-Luke et al. 2018 |
| Electrolyzer CAPEX (same case) | ±£65/kW ≈ ±£10/t | Nayak-Luke et al. 2018 |
| Synthesis-loop minimum load (same case) | ±12% of rated power ≈ ±£10/t | Nayak-Luke et al. 2018 |
| Plant flexibility premium vs. ideal supply | ≥1.56× a constant-power estimate | Nayak-Luke & Bañares-Alcántara 2020 |
The electricity rule converts directly to procurement thresholds: 2021 auction prices of $39 (solar) and $43 (onshore wind) per MWh implied $390–430 of electricity cost per tonne of ammonia. An LCOE below $20/MWh implies under $200/t in electricity cost alone.
The AWE electrolyzer energy consumption figures used here (52.5 kWh/kg H₂) are consistent with the specifications in our AWE vs. PEM comparison. SOEC at 7.2 MWh/t is Topsoe's estimate and reflects a fundamentally different operating temperature regime.
A Checklist for a Defensible LCOA
- State the boundary: generation in or out, islanded or grid-connected, plant gate or delivered
- Build the balance from stoichiometry: 177.6 kg H₂, 822 kg N₂, approximately 1.6 t water per tonne of ammonia
- Use an 8,760-hour power profile, not an annual capacity factor
- Size electrolyzer, synthesis loop, and generation together, with hydrogen buffer and curtailment as explicit variables, not residuals
- Model synthesis-loop turndown and ramp limits, these directly reduce the storage requirement
- Cost every component over its own life, including stack replacements triggered by operating hours
- Discount each asset class at a rate that reflects its risk
- Report sensitivity to electricity price, electrolyzer CAPEX, and discount rate, and state the cost-year basis
Key Takeaways
LCOA is a method before it is a number. Boundary and sizing choices move it by more than most technology choices do. The $473/t to $1,400/t spread in published figures is primarily a methodology spread, not a resource quality spread.
The $178/t rule is worth memorizing. Every $1/kg of delivered hydrogen cost adds approximately $178 to each tonne of ammonia. The hydrogen cost and the electricity price set the floor. Nothing else in the cost stack moves the number as far.
Variable power adds a flexibility premium of at least 56% over ideal-supply estimates. Any LCOA calculated without hourly dispatch modeling is a lower bound. The Oxford study's 1.56× scaling factor applies to all islanded renewable ammonia systems, not just the sites in that paper.
Coupling sizing, dispatch, and discounting in a single model is the step where spreadsheets give out and where most pre-FEED feasibility studies underestimate the true cost.
Engineering Notes
Read in full: The Nayak-Luke 2020 paper and the first ~48 pages of the IRENA/AEA Innovation Outlook. All figures attributed to these sources come from those texts.
Abstract or snippet level only: The 2018 Oxford paper, the 2026 Aspen Plus study, the 2025 Green-NH₃@Scale paper, the AEA/Topsoe article, and greenammonia.info. The IEA figures come through the C-THRU summary rather than the IEA roadmap directly; verify these against the original IEA Ammonia Technology Roadmap (2021) before using in client-facing deliverables. Author list and journal name for the Green-NH₃@Scale paper not confirmed.
Calculated, not sourced: Stoichiometry (177.6 kg H₂, 822 kg N₂), the 9.3 MWh/t electrolysis figure, the capital recovery factors and derived examples, the $178/t hydrogen shortcut, and the 18.6 GJ/t heating value implied by cross-source $/GJ conversions.
Formula note: The LCOA discounting formula shown is the standard form consistent with the Oxford paper's description. The paper's own equation did not render cleanly in the fetched text; verify against supplementary information before attributing the exact form to the authors.
Vintage: Best-site cost figures rest on 2019–2021 cost bases. Electrolyzer and renewable costs have moved since. A refresh against 2025–2026 data would strengthen the benchmark table.
Flexibility premium: The 2030 figure is reported as 76% in the Oxford paper's summary and 77% in the body, written here as "about 76–77%".
References
[1] Nayak-Luke, R.M. and Bañares-Alcántara, R. Techno-economic viability of islanded green ammonia as a carbon-free energy vector and as a substitute for conventional production. Energy & Environmental Science 13(9), 2957–2966 (2020). https://doi.org/10.1039/d0ee01707h
[2] IRENA and Ammonia Energy Association. Innovation Outlook: Renewable Ammonia (2022).
[3] Nayak-Luke, R., Bañares-Alcántara, R. and Wilkinson, I. "Green" Ammonia: Impact of Renewable Energy Intermittency on Plant Sizing and Levelized Cost of Ammonia. Industrial & Engineering Chemistry Research (2018). https://doi.org/10.1021/acs.iecr.8b02447
[4] C-THRU. Ammonia Technical Brief (June 2022), summarizing IEA, Ammonia Technology Roadmap (2021).
[5] Ammonia Energy Association. Green ammonia: Haldor Topsøe's solid oxide electrolyzer.
[6] Performance Analysis of an Alkaline Water Electrolysis–Cryogenic Air Separation–Ammonia Synthesis System Based on Multi-Stage Compression Power Optimization. Applied Sciences 16(15), 7501 (2026).
[7] Comprehensive techno-economic assessment of Green-Ammonia@Scale production. ScienceDirect (2025).
[8] greenammonia.info. Green Ammonia Production (electrolysis energy figures).