
Ask a project team what electrolyzer capacity factor they are targeting and the answer is usually "as high as possible." The reasoning is sound. An electrolyzer is a capital asset, and every idle hour spreads its fixed costs over fewer kilograms of hydrogen.
That reasoning breaks down when the electricity is variable. Two bodies of published work reach opposite conclusions about what a higher capacity factor does to LCOH. Both are right. They differ in what they hold constant.
What Capacity Factor Means for an Electrolyzer
Capacity factor (CF) is annual hydrogen output divided by what the electrolyzer would produce at rated power for all 8,760 hours of the year. Multiplying CF by 8,760 gives equivalent full-load hours:
| Capacity factor | Equivalent full-load hours/year |
|---|---|
| 27% | ~2,365 h |
| 50.85% | ~4,455 h |
| 70% | ~6,132 h |
| 90% | ~7,884 h |
Capacity Factor is not availability. Lazard's model assumes a 98% availability factor and treats utilization as a separate input, a distinction that matters when interpreting sensitivity results.
Case 1: With a Fixed Electricity Price, Utilization Is a CAPEX Problem
Lazard's Levelized Cost of Hydrogen Analysis (Version 2.0, October 2021), produced with Roland Berger and drawing on data from FCHEA, NREL, and PNNL, sensitizes LCOH to electrolyzer utilization at fixed electricity prices. It uses a 20-year horizon and solves for a 12% levered equity return. At $40/MWh electricity, its alkaline cases give:
| Utilization | 1 MW | 20 MW | 100 MW |
|---|---|---|---|
| 90% | $4.52/kg | $3.36/kg | $3.26/kg |
| 75% | $4.73/kg | $3.36/kg | $3.25/kg |
| 60% | $5.11/kg | $3.42/kg | $3.29/kg |
| 45% | $5.72/kg | $3.48/kg | $3.32/kg |
| 30% | $6.95/kg | $3.63/kg | $3.41/kg |
| Change, 90% to 30% | +53.8% | +8.0% | +4.6% |
Source: Lazard LCOH Analysis v2.0 (October 2021). Percentage changes calculated from published values.
Two patterns stand out.
Scale decides how much utilization matters. Dropping from 90% to 30% adds 54% to LCOH at 1 MW and only 4.6% at 100 MW. The driver is CAPEX intensity: Lazard's medium-efficiency alkaline case is $1,460/kW at 1 MW and $630/kW at 100 MW. PEM cases show the same shape: +59% at 1 MW and +4.6% at 100 MW.
The penalty accelerates at low utilization. At 1 MW, falling from 90% to 75% adds $0.21/kg. Falling from 45% to 30% adds $1.23/kg. The penalty is not linear.
In this framing, the answer is always "run more hours." That holds only if every additional hour costs the same to power, which is precisely the assumption that the next study removes.
Case 2: Capacity Factor Optimization When Supply Is Variable
Sebbahi et al. (Journal of Power Sources, 2026) frame the problem differently. They model a 20 kW alkaline electrolyzer coupled to PSO-optimized PV, wind, and battery capacity at five Moroccan sites, and analyze the trade-off between reliability and cost in an off-grid system.
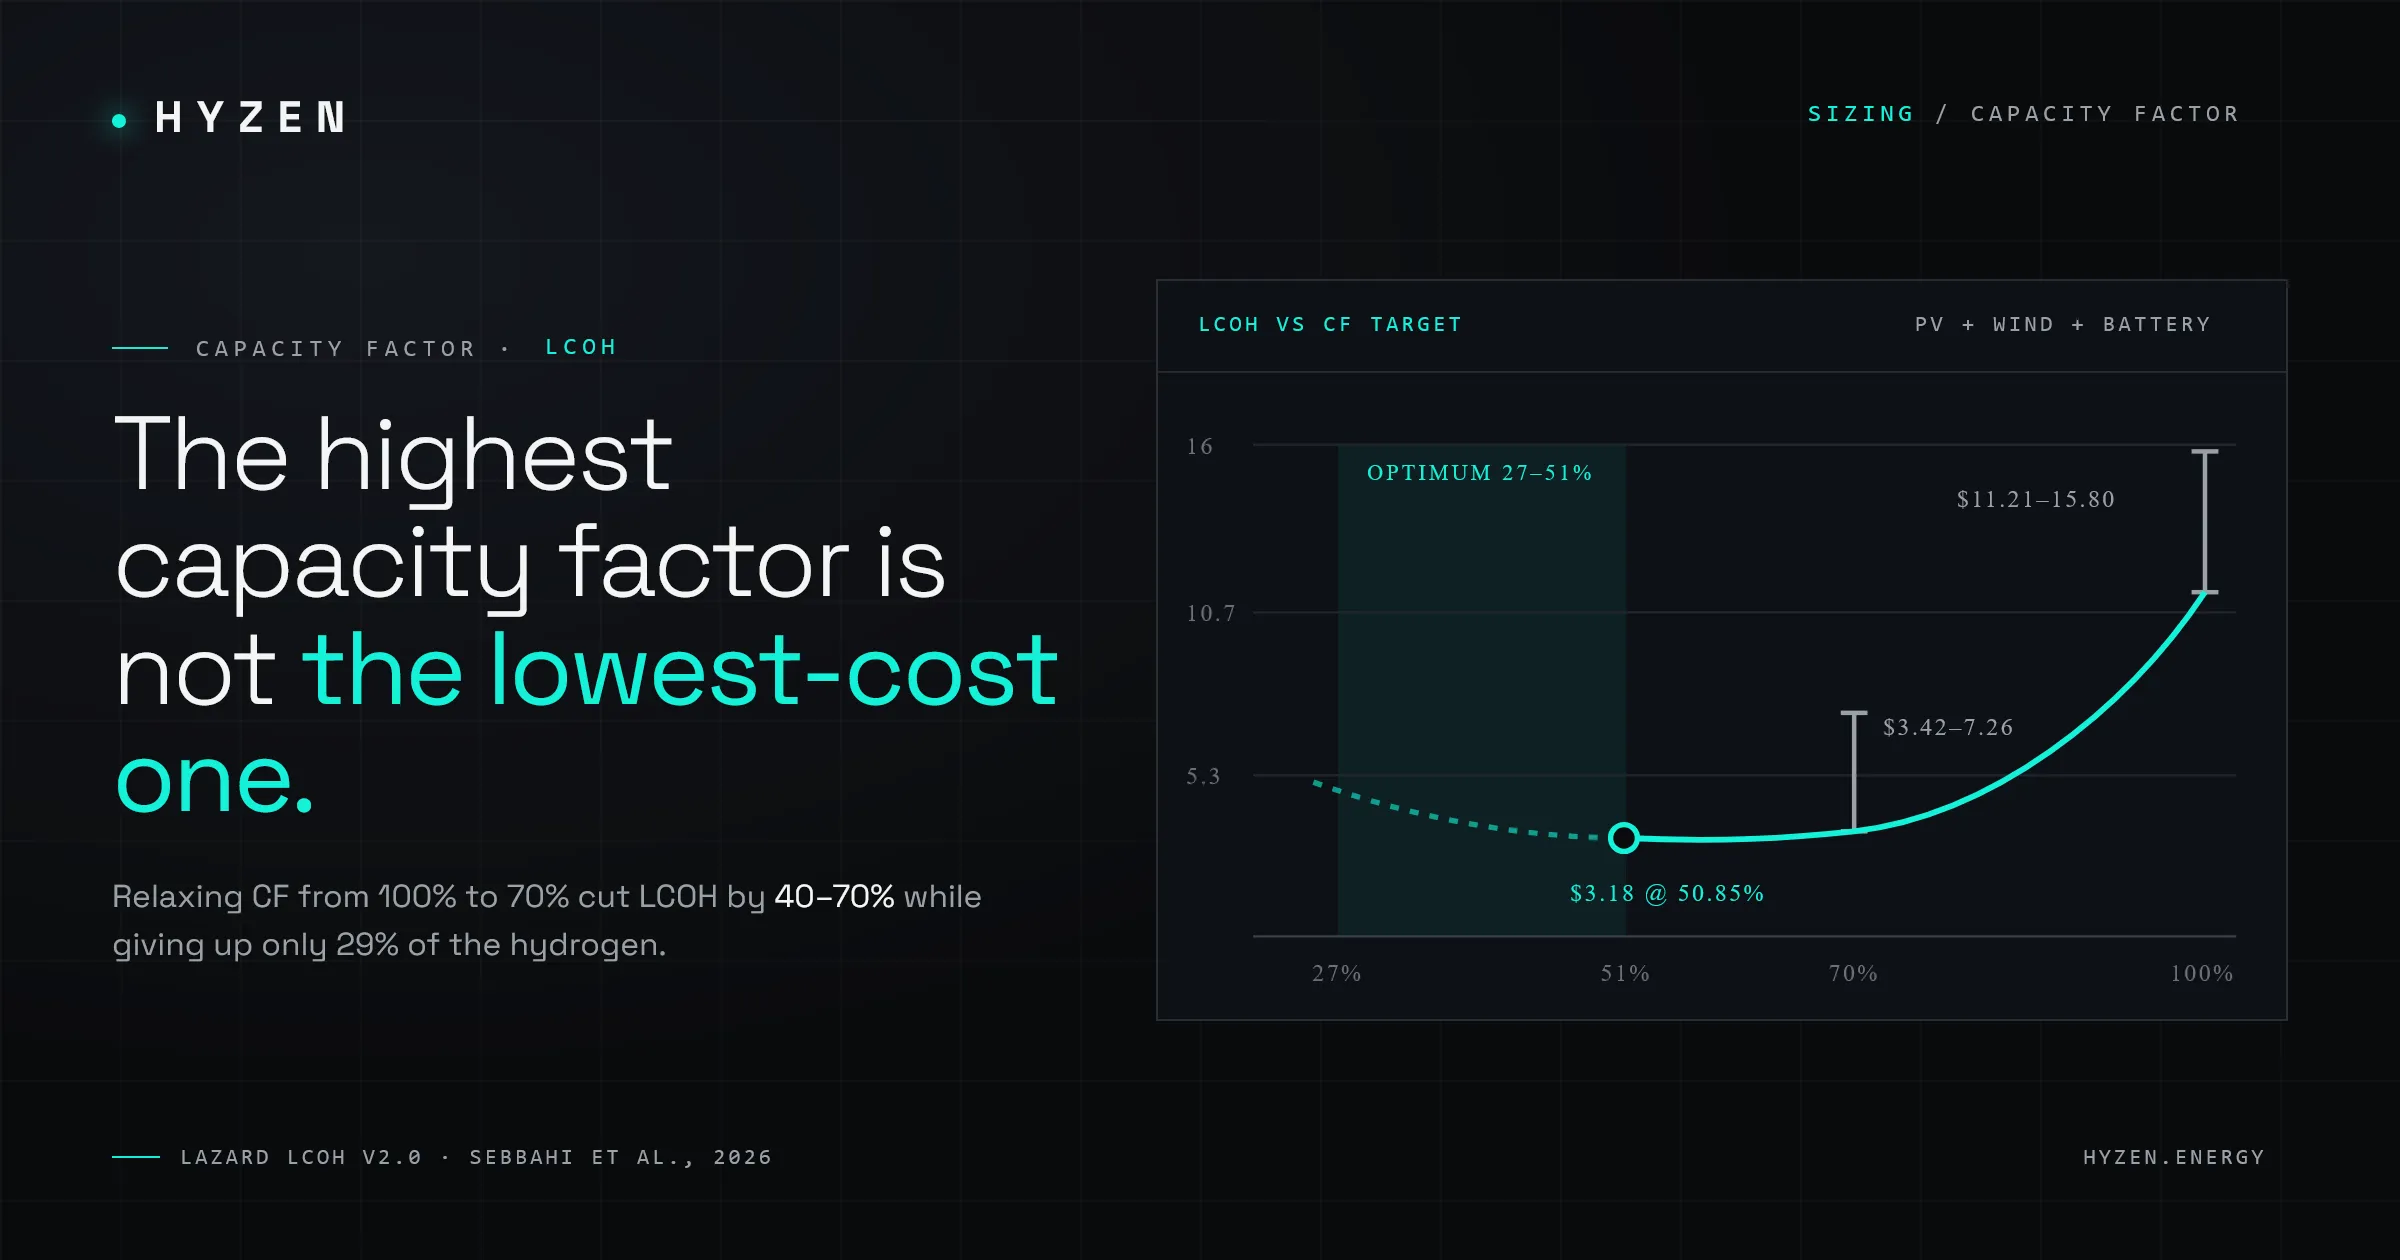
The results are stark. Relaxing the CF requirement from 100% to 70% lowered LCOH from $11.21–15.80/kg to $3.42–7.26/kg, a reduction of 39.6% to 69.5% depending on site, while total hydrogen production fell 29.1%. The best site (Dakhla) reached $3.18/kg at a 50.85% CF. The optimum CF across the five sites ranged from 27% to 51%.
Battery CAPEX, PV CAPEX, and discount rate dominated the sensitivity results. Electrolyzer CAPEX was comparatively minor.
The mechanism is straightforward engineering: holding an electrolyzer at rated power through nights, calm spells, and seasonal lows forces the system to overbuild generation capacity and size storage for the worst hours of the year. The last stretch of CF is bought with the most expensive kilowatt-hours in the system. Giving up 30 percentage points of CF cost about 29% of the hydrogen and cut LCOH by 40–70%. The hydrogen surrendered was the most expensive hydrogen in the system.
Reconciling the Two Studies
| Lazard (2021) | Sebbahi et al. (2026) | |
|---|---|---|
| Electricity price | Fixed $/MWh, independent of CF | Emerges from PV, wind, and battery sizing, rises with CF target |
| System boundary | Electrolyzer plant; intermittency enters only through the utilization input | PV + wind + battery + electrolyzer, off-grid |
| Scale | 1, 20, and 100 MW | 20 kW |
| Effect of higher CF on LCOH | Lowers it | Raises it sharply beyond the optimum |
The practical question is not what CF you can reach. It is what the next point of CF costs in generation and storage, and what it earns in additional hydrogen. The cost-minimizing CF sits where those two curves meet. A fixed-price model cannot find that point because the electricity price never responds. A system model can.
One caveat on scale: a 20 kW off-grid system is not a 100 MW grid-connected plant, so read the magnitudes as specific to that configuration. The mechanism carries over to larger systems. The optimum CF itself will not.
What Other Studies Add
Pilot-scale evidence confirms small-plant sensitivity. A 2024 analysis of a solar-plus-hydro alkaline pilot in Brazil (Riedel et al., Energies 17(17), 4521) found LCOH of $13.00/kg and identified capacity factor as the main LCOH determinant, consistent with the small-plant result in Lazard's data, where CAPEX per kilogram is high and utilization carries outsized weight.
Curtailment is what CF costs. A 2026 review reports curtailment above 30–40% in PV-electrolyzer systems without storage, falling to 10–20% with 4 hours of battery. Wind-electrolyzer systems typically see 10–20% curtailment. Hybrid PV-wind systems see 20–35% without storage and under 15% with a 4-hour battery. Hybridization and storage are both ways to buy CF, and they carry different prices and different LCOH implications.
Lowest cost per kilogram and highest volume are different objectives. A large-scale sensitivity study using net-metering assumptions found PV alone reached $3.79/kg at average parameters, while PV-wind reached $3.97/kg at its optimal electrolyzer size, but the hybrid delivered substantially more total hydrogen. Which configuration wins depends on what your offtake contract rewards: minimum LCOH or maximum production volume. These are not always the same answer.
Capacity Factor Also Sets Stack Life
Stack replacement is driven by operating hours, so CF sets the replacement calendar, and replacement is a real capital event, not a footnote.
Lazard's model schedules stack replacement from availability, utilization, and stack lifetime in hours. Its alkaline cases assume stack lifetimes of 60,000 to 75,000 hours. The IEA's assumptions annex uses 50,000 hours as its economic-optimum value while noting that stacks can reach up to 95,000 hours.
Take a 60,000-hour stack:
| Capacity factor | Full-load hours/year | Stack life | Replacements in 20-year project |
|---|---|---|---|
| 90% CF | 7,884 h/yr | ~7.6 years | 2 replacements |
| 50.85% CF (Dakhla) | 4,455 h/yr | ~13.5 years | 1 replacement |
| 27% CF (solar-only) | 2,365 h/yr | ~25+ years | 0 replacements |
Calculated from Lazard stack lifetime assumptions. Ignores availability losses and voltage-triggered early replacement.
The Sebbahi study reports that a lower CF delays stack replacement to year 13 at Dakhla, consistent with this calculation. In Lazard's 20 MW medium alkaline case, the stack alone is $345/kW, so each avoided replacement at 20 MW is approximately $6.9M in mid-life CAPEX. That number belongs in every CF optimization model.
This connects directly to the analysis in our AWE vs. PEM comparison, where stack replacement count was identified as one of the four numbers that actually drive the technology decision at scale.
A Working Method for Optimizing Capacity Factor
Start from hourly profiles. An annual average CF hides how the hours are distributed. A 50% CF achieved with smooth wind is fundamentally different from 50% achieved with concentrated daytime solar and 12 dead hours each night. Use 8,760-hour generation data, not annual averages.
Treat sizing as a design variable. Sweep the generation-to-electrolyzer ratio and the CF target together, not one at a time. Glenk and Reichelstein's Nature Energy analysis (2019) models a hybrid system by pairing renewable generation with an efficiently sized power-to-gas facility and sweeping these variables simultaneously, the approach that finds the economic optimum rather than an assumed one.
Price the marginal point. For each step in CF, compute the added generation and storage cost against the added hydrogen revenue. The optimum is where the next percentage point of CF costs more in infrastructure than it earns in hydrogen. This is the calculation that fixed-price spreadsheet models structurally cannot perform.
Model stack replacement in operating hours, not calendar years. A CF decision made without its stack replacement effect is priced incompletely. The replacement cost is large enough at 20 MW+ to shift the CF optimum by several percentage points.
Stress the answer. Run the optimized CF against discount rate and CAPEX sensitivity, the levers covered in our CAPEX vs. discount rate analysis. A CF optimum that is robust across WACC scenarios is more bankable than one that depends on a single financing assumption.
Key Takeaways
With a fixed electricity price, more utilization always lowers LCOH, and it matters most for small plants (+54% penalty at 1 MW going from 90% to 30% utilization, vs. +4.6% at 100 MW). At utility scale, underutilization is a manageable cost; at small scale, it is frequently the dominant cost driver.
With variable supply, the price of electricity depends on the CF you demand, and the cost-minimizing CF is often well below the maximum (27–51% across five sites in Sebbahi et al.). Pushing for maximum utilization in an off-grid or curtailment-constrained system forces you to overbuild the most expensive components for the worst hours of the year.
Capacity factor also sets stack life, curtailment rate, and the trade-off between lowest cost per kilogram and highest production volume. These cannot be optimized independently. A CF decision made in isolation from sizing, storage, and replacement schedule will be wrong, and it will be wrong in a direction that the project's financial model may not catch until late-stage.
Running these sweeps across generation ratios, CF targets, and stack schedules simultaneously is where spreadsheet models give out. It is also where the largest gaps between projected and realized LCOH tend to originate.
Engineering Notes
Verified against full source: All Lazard values are from the published PDF (v2.0, October 2021). Sebbahi et al. figures are from the published abstract and paper on ScienceDirect.
Abstract-level only: The Brazil pilot study (Riedel et al.), the 2026 curtailment review, and the December 2024 PV-wind sensitivity study were accessed at abstract or summary level. The engineer should confirm figures against the full papers before citing them in client-facing deliverables.
Calculated, not sourced: Full-load-hour conversions, percentage changes in the utilization table, and the stack replacement year calculations are derived arithmetic, not claims from the cited papers.
Vintage note: Lazard v2.0 is from 2021. Lazard has since published updated LCOH versions (v4.0 referenced in a June 2024 report). The article dates its source explicitly. A refresh with current cost bases would be appropriate before 2027.
References
[1] Lazard. Levelized Cost of Hydrogen Analysis: Version 2.0 (October 2021). Produced with Roland Berger; data from Fuel Cell and Hydrogen Energy Association, NREL, and Pacific Northwest National Laboratory.
[2] Sebbahi, S. et al. Modeling and techno-economic assessment of a 20 kW alkaline green hydrogen micro-pilot powered by hybrid solar-wind systems in Morocco. Journal of Power Sources 677 (2026) 240015. https://doi.org/10.1016/j.jpowsour.2026.240015
[3] Riedel, A.B.B.S. et al. Technical-Economic Analysis of Renewable Hydrogen Production from Solar Photovoltaic and Hydro Synergy in a Pilot Plant in Brazil. Energies 17(17), 4521 (2024).
[4] Solar and wind powered green hydrogen systems: A review. ScienceDirect (2026).
[5] Sensitivity-based techno-economic assessment approach for electrolyzer integration with hybrid photovoltaic-wind plants for green hydrogen production. ScienceDirect (December 2024).
[6] Glenk, G. and Reichelstein, S. Economics of converting renewable power to hydrogen. Nature Energy 4, 216-222 (2019). https://doi.org/10.1038/s41560-019-0326-1
[7] IEA. Global Hydrogen Review: Assumptions Annex.