
P50 / P90 Energy Yield
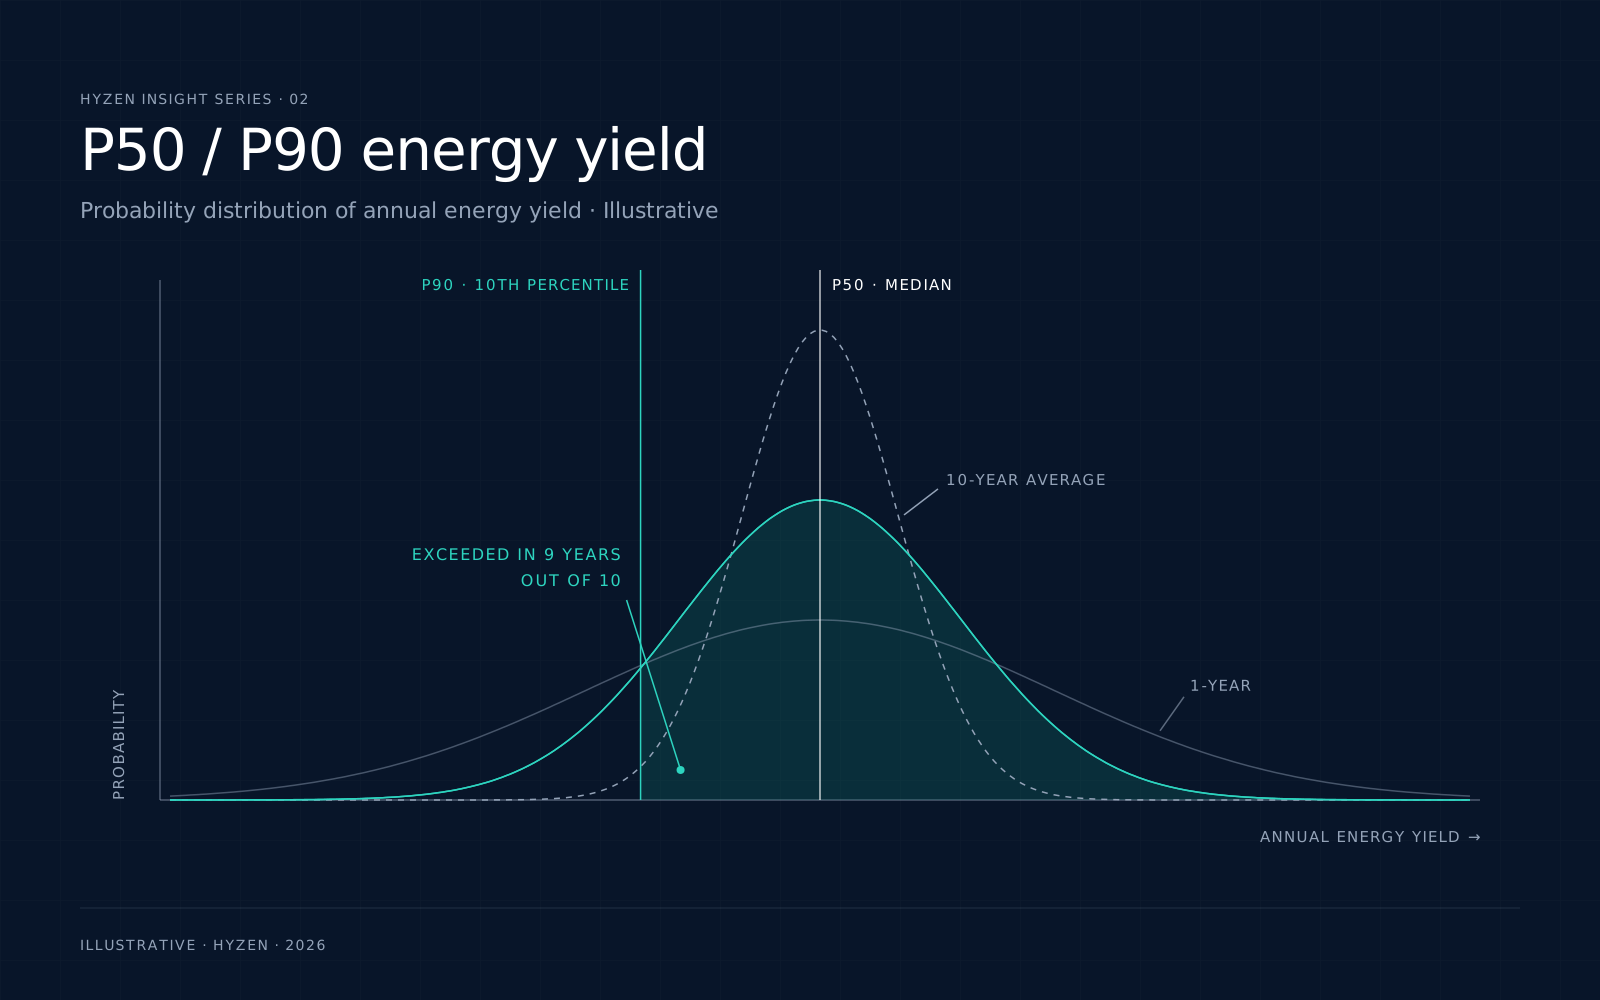
P50 and P90 solar and wind yield are annual energy estimates exceeded with 50 % and 90 % probability; lenders typically size project debt on the P90 value.
In plain terms
No one knows next year's sunshine or wind. A yield assessment therefore gives a probability distribution of annual energy, not one number.
- P50 is the median: in half of all years, production will be higher.
- P90 is the conservative case: production should exceed it in nine years out of ten.
Both are exceedance probabilities, and they are used to judge the financing risk from year-to-year resource variability (NREL, 2012). The gap between them comes from two sources: uncertainty in the resource data and models, and real year-to-year weather variability. For a single year, inter-annual variability widens the gap; over a ten-year average, it narrows.
For a hydrogen plant, the renewable yield sets the power supply, so a P90 energy year means roughly a P90 hydrogen year. It is only approximate, because curtailment and minimum load make hydrogen output non-linear in energy.
Typical range
The P90/P50 ratio depends on resource type, the length of the weather record and the site, so it is calculated per project. The source cited here covers solar; wind yield assessments use the same exceedance definitions with their own variability data.
Why it moves LCOH
Equity investors look at P50 returns. Lenders typically size debt so the project can repay it in a P90 year. A wide P50 to P90 gap therefore reduces the debt a project can carry, increasing the share of more expensive equity and raising the effective WACC. A hydrogen offtake contract also needs to survive a P90 year without penalties.
Common mistake
Related terms
Sources
- P50/P90 Analysis for Solar Energy Systems Using the System Advisor Model, National Renewable Energy Laboratory (Dobos, Gilman and Kasberg), NREL/CP-6A20-54488, 2012