
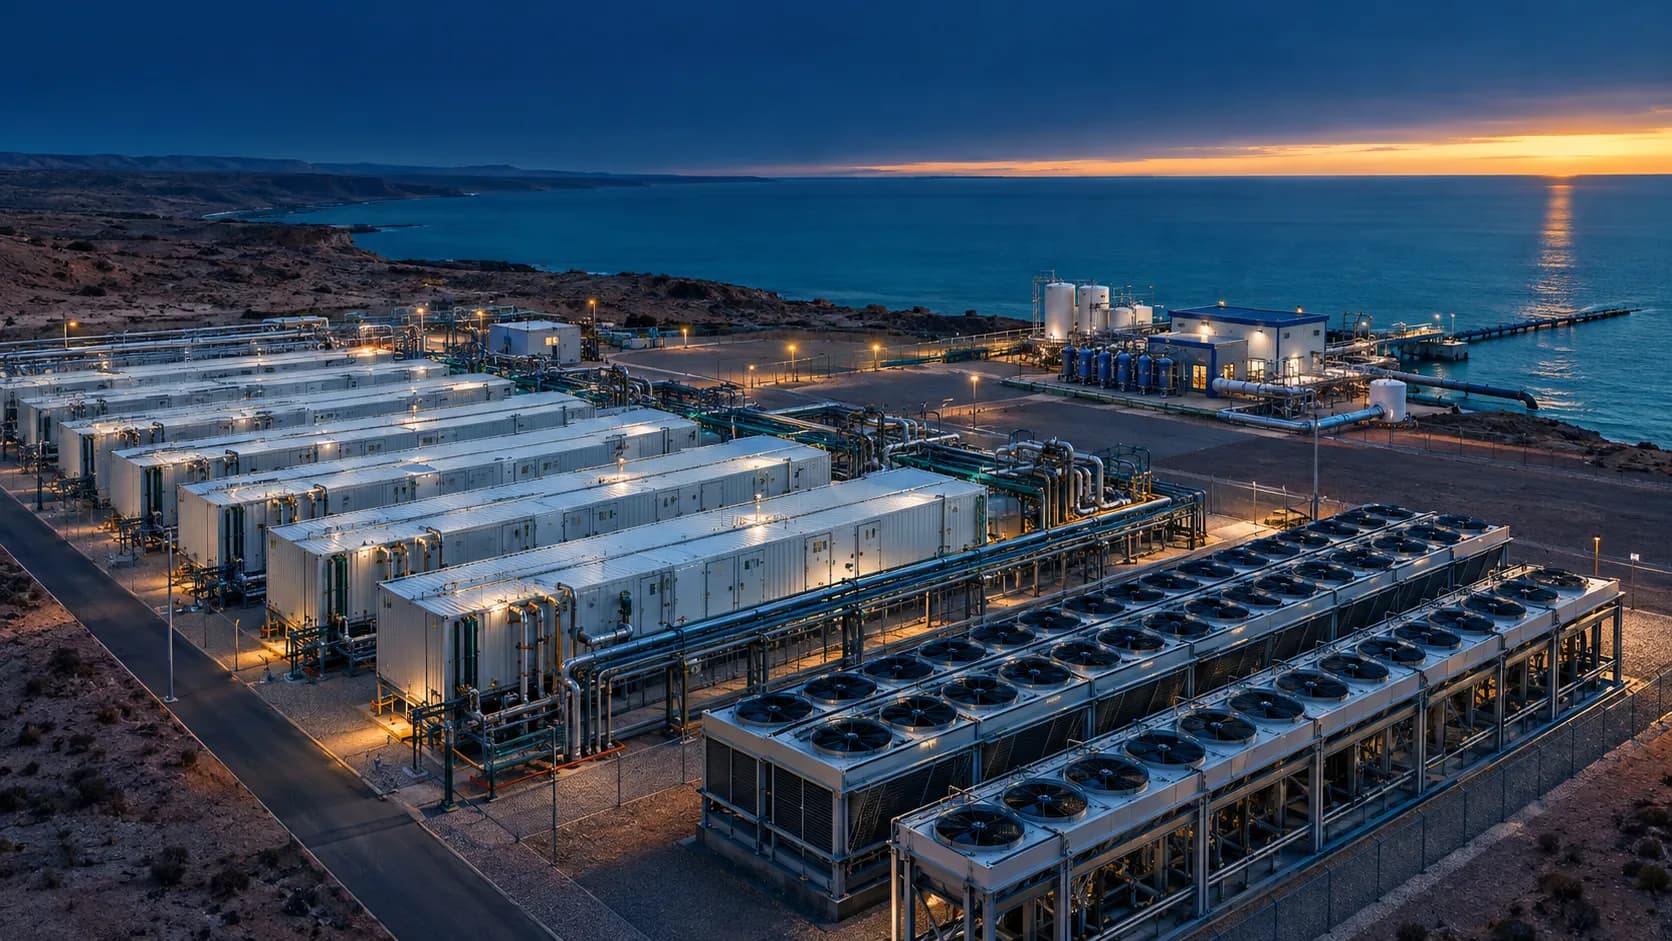
On 8 October 2026, the European Commission's Joint Research Centre (JRC) published the most detailed map yet of hydrogen's pull on Europe's freshwater. It covered about 1,300 existing and planned production assets. The headline is reassuring: 91% of assets in 2030 would add negligible to minimal pressure on their basins. The fine print is not: by 2050, 10% to 10.7% of assets sit in a more sensitive water context.
That split is the real answer to "how much water does green hydrogen need?" At continental scale, very little. At the scale of one basin, one aquifer or one coastal intake, enough to stall a permit. In a survey cited alongside the JRC study, developers ranked water availability only sixth among site-selection factors. This article explains where the litres go and how to design for them before pre-FEED.
The 9 L/kg floor: stoichiometry
Water electrolysis splits H₂O into hydrogen and oxygen. The mass balance sets a hard minimum: 9 litres of water per kilogram of hydrogen. No electrolyzer technology goes below it, because that water leaves the plant as product.
The 9 L/kg figure is the one most often quoted. It is also the one least useful for design. Your water treatment plant, cooling system and permit application all deal with a much larger number.
From 9 to 30: where the rest of the water goes
Two systems sit between the raw water intake and the stack: purification and cooling. RMI estimates they add about 10–20 L/kg combined, for a total of 20–30 L/kg. Manufacturer data compiled by the JRC gives 10 to 22 L/kg processed within the electrolyzer itself.
The JRC report also breaks typical totals down by technology:
| Technology | Typical total water consumption (L/kg H₂) |
|---|---|
| Alkaline (AWE) | 21–24 |
| PEM | 17–18 |
| Solid oxide (SOEL) | 11–17 |
| Steam methane reforming (SMR), for comparison | 20 total demand; about 15.7 raw consumption |
| Autothermal reforming (ATR), for comparison | 24 raw consumption, of which 21.8 for cooling |
Source: JRC, Spatial assessment of the impact of hydrogen production on European freshwater resources (2026), pp. 8–13.
Two points follow. First, green hydrogen is not a water outlier: the US Department of Energy describes electrolysis water use as comparable to steam methane reforming. Second, the technology choice moves the number, but not by an order of magnitude. If you are still weighing stack technologies, our AWE vs PEM comparison covers the other trade-offs.
Cooling is the biggest design lever
The ranges above hide one assumption: how you reject heat. The JRC's asset-level analysis assumes wet cooling, "the most water-intensive option". Its 2050 risk figures are therefore conservative.
A 2026 life-cycle study of PEM electrolysis in arid areas by Sinha et al., summarised by Physics World, puts numbers on the alternative:
- About 13 L/kg in the best case with dry cooling, of which about 3.5 L/kg is lost in water treatment.
- Dry cooling uses about three times less water than wet cooling.
- Brine recovery can cut the treatment loss by about 50%, depending on location and infrastructure.
One reference project already runs this way. The article cites a 100 MW PEM plant in Pecos, Texas, at Infinium's Project Roadrunner e-SAF facility, which uses dry cooling.
Dry cooling is not free. Air-cooled heat exchangers take more plot area and fan power, and they lose performance on hot days, exactly when solar-driven plants run hardest.
That is why the cooling choice belongs in the same model as your capacity factor and your LCOH optimisation, not in a later utilities package.
Water is cheap. Water risk is not.
On cost, water barely registers. The US DOE estimates that seawater desalination adds about $0.01 to $0.04 per kg of hydrogen. That is a rounding error next to electricity and electrolyzer CAPEX.
The risk sits elsewhere: permits, community acceptance and supply security. A project rarely stalls on the price of water; it stalls on access to it. (For the wider pattern of project exits, see our review of why green hydrogen projects get cancelled.) Three geographies show how developers are responding:
- Southern Europe. The JRC flags higher-pressure cases in Greece, Spain, Italy, Portugal and parts of central Europe, and puts North Sea hubs in Belgium, the Netherlands and north-west Germany on a watch list because some projects there are very large.
- Oman. A planned integrated project in Sohar pairs 100,000 m³/day of desalination with 250 MW of floating solar, 100 MWh of batteries and a 50 MW green hydrogen unit, with water also sold to industrial and port customers.
- Chile. A PtX Hub study with Chile's Ministry of Energy expects seawater to provide the majority of water for electrolysis, and points to the country's 40 m³/s of treated wastewater as a further source.
For scale, a simple illustration: a plant producing 100 tonnes of hydrogen per day needs about 1,300 m³/day of water at 13 L/kg, 2,000 m³/day at 20 L/kg and 3,000 m³/day at 30 L/kg. That is a small desalination unit, but a meaningful draw on a stressed aquifer.
A site-level water checklist for pre-FEED
Use this list before you commit to a site or a stack:
- Pick the right number. Size intake and treatment on total consumption (13–30 L/kg depending on technology and cooling), not on 9 L/kg.
- Decide the cooling concept early. Wet versus dry cooling can shift total water use by a factor of about three, and it changes plot plan and parasitic load.
- Rank your water sources. The JRC points to desalination in coastal areas, wastewater and brackish water as ways to reduce pressure on freshwater.
- Design the reject stream. Treatment losses are a real share of the total; plan brine recovery or disposal with the permit in mind.
- Test the basin, not the country. National water statistics hide local stress. Check abstraction against renewable water in your basin, under a pessimistic climate scenario.
- Engage early. The JRC advises developers to engage early with local authorities and assess site-specific freshwater or reclaimed sources.
For ammonia projects, carry the same water figures through to your green ammonia LCOA model: the synthesis loop adds its own cooling duty.
Conclusion: design for the basin
Green hydrogen needs 9 litres of water per kilogram by chemistry, and 13 to 30 litres in practice. At regional scale that is modest: the JRC puts Europe's 2030 hydrogen water demand at 0.08–0.12% of annual freshwater demand. At site scale, it is a design variable that touches cooling, treatment, permitting and community acceptance.
The projects that move fastest treat water as an input to the first screening, not as a utilities line in FEED. Hyzen's platform models water demand alongside renewable input, electrolyzer sizing, gas conditioning, compression, storage and RFNBO checks. Start with the free Site Screener to test a location before you spend on studies.
References
[1] Julien Bolard, Marco Serafini, Lara Kurz, Alberto Pistocchi, Eveline Weidner. Spatial assessment of the impact of hydrogen production on European freshwater resources. European Commission Joint Research Centre, JRC148090 (2026).
[2] Smart Water Magazine. Most European hydrogen plants will add little pressure on local water, JRC study finds. Smart Water Magazine (2026).
[3] Kaitlyn Ramirez, Tessa Weiss, Thomas Kirk, Chathurika Gamage. Hydrogen Reality Check: Distilling Green Hydrogen's Water Consumption. RMI (2023).
[4] Lorna Brigham. Water use in green hydrogen production. Physics World (2026). Summarising Parikhit Sinha et al., "Addressing water usage challenges for electrolyzer operations in arid areas", Progress in Energy 8, 025005 (2026).
[5] US Department of Energy, Hydrogen and Fuel Cell Technologies Office. Can water usage for electrolysis pose problems for parts of the United States currently facing water shortages?. US DOE.
[6] SolarQuarter. Oman plans integrated renewable energy, desalination and green hydrogen project in Sohar. SolarQuarter (2026).
[7] PtX Hub. Chile's green hydrogen ascent: seawater desalination and wastewater reuse for PtX production. PtX Hub (2024).