
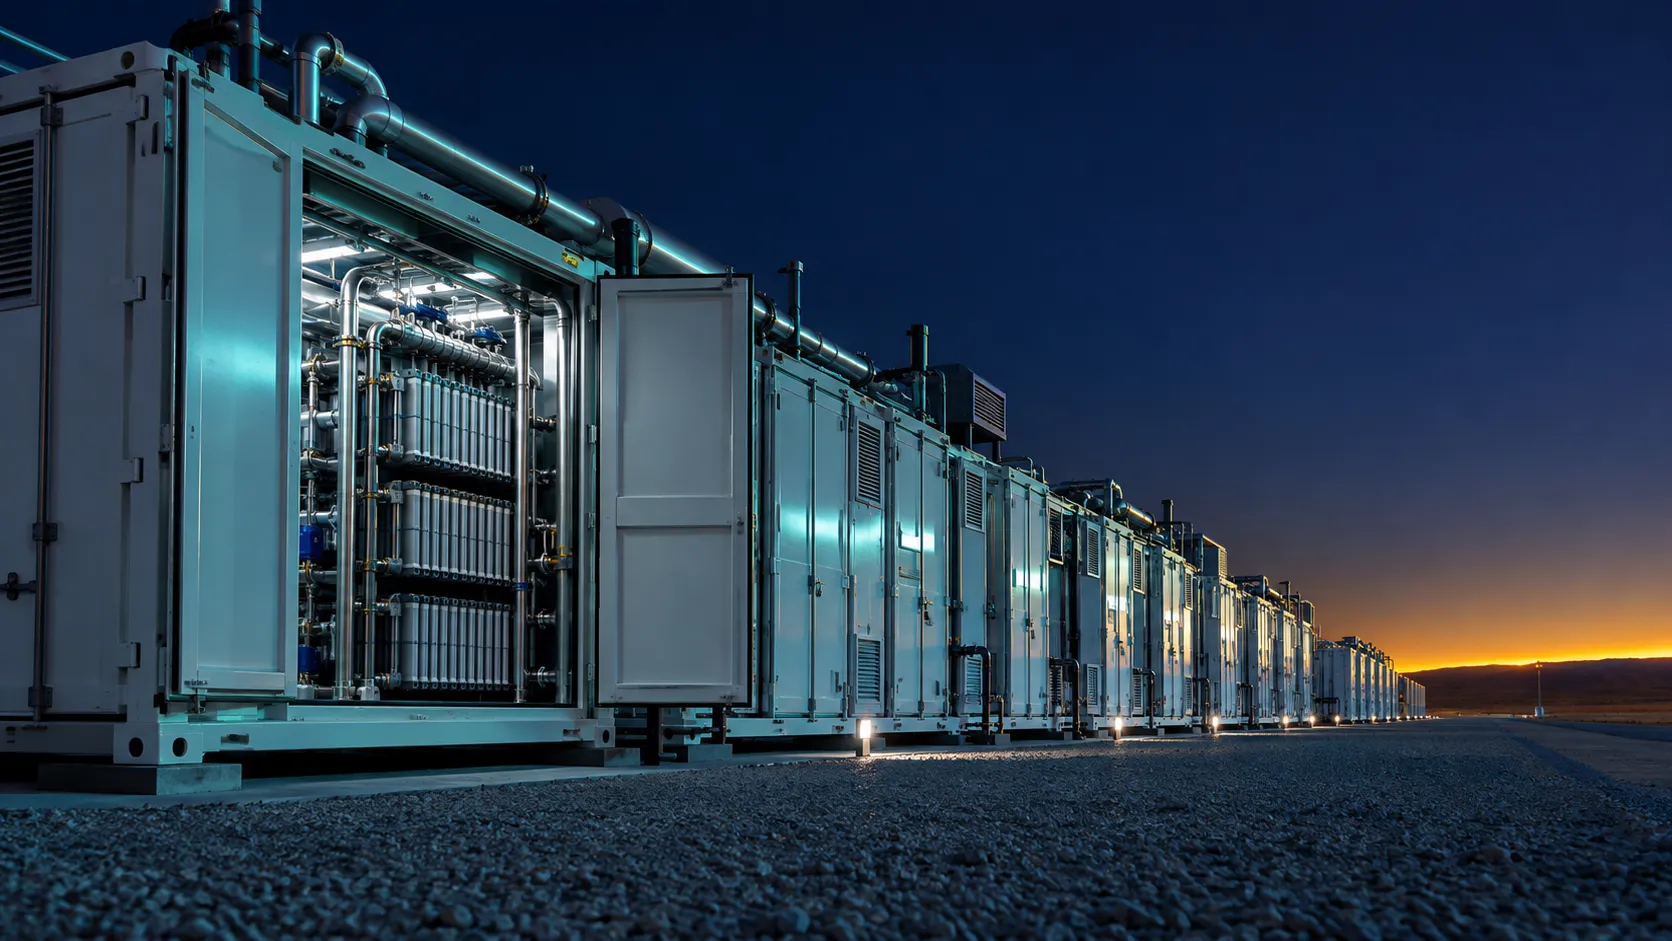
In December, Brussels opens its fourth European Hydrogen Bank auction with a proposed €500 million budget [7]. The draft terms say at least 75% of a project's electrolyzers must come from outside China [5]. Meanwhile, Chinese suppliers keep shipping. Sungrow Hydrogen shipped 160 MW of alkaline electrolyzers to ACME Group's green ammonia project in Oman [9]. In Portugal, a German-Chinese joint venture won a 10 MW order for the Green Hydrogen Sines project [8].
So every developer, EPC contractor and consultant now faces the same question: how big is the Chinese electrolyzer cost vs Western gap really, and what does it do to the levelized cost of hydrogen (LCOH)? The short answer: the gap is large at the factory gate, much smaller at the fence line, and only one input among several that decide your LCOH.
The factory-gate gap is real
The World Bank's February 2026 technical paper, Electrolysers for Hydrogen Production: Technical and Economic Characteristics, gives the clearest recent benchmark [1]. Chinese alkaline (ALK) systems cost roughly $270–$280/kW for the domestic market and about $350/kW ex-factory for export. Comparable ALK systems made in Europe or the United States cost $800/kW ex-factory.
For PEM, the gap is narrower. The same paper puts complete Chinese PEM systems at $700–$1,000/kW, against $1,000–$1,600/kW ex-factory for European systems.
Stack prices in China have fallen fast. CRU tracked Chinese alkaline stack bids in CEEC tenders falling from about $0.35 M/MW to about $0.20 M/MW between 2021 and 2022, then to just below $0.15 M/MW in recent bids [2]. CRU says the lowest 2025 single-stack price, about $0.13 M/MW, is "essentially at cash cost."
This is backed by scale. China holds 86% of global alkaline electrolyzer manufacturing capacity [1], and its share of total electrolyzer manufacturing capacity rose from 5% to 60% in less than a decade [3].
Why the gap shrinks once the plant is built
The stack is not the plant. The World Bank paper says the stack typically represents only 20–50% of direct CAPEX. Balance of system and balance of plant jointly represent 50–80%, and installation and EPC often account for 40–50% of total CAPEX [1]. CRU's numbers point the same way: the stack is about 15–20% of total capex for an integrated, ready-to-operate plant, and plant-level balance of plant is about 60% of installed project costs in Western markets [2].
Most of that cost is local: civil works, power connection, water treatment, compression, labor and engineering. A cheaper stack does not change it.
The World Bank's installed figures show the effect. In emerging markets, installed ALK costs range from $800–$1,200/kW for Chinese systems and $1,200–$1,800/kW for European systems [1].
| Alkaline cost basis (World Bank, 2026) | Chinese | European | Gap at midpoint* |
|---|---|---|---|
| Ex-factory, export ($/kW) | ~350 | 800 | ~56% lower |
| Installed, emerging markets ($/kW) | 800–1,200 | 1,200–1,800 | ~33% lower |
*Our arithmetic on the World Bank figures: $350 vs $800, and range midpoints of $1,000 vs $1,500.
The gap does not vanish. It drops from more than half to about a third once you build the plant.
Like-for-like, the gap is smaller still
CRU makes a second correction. Chinese 2025 alkaline capital costs sit at about $1.0 M/MW or just below, 50–60% lower than Western systems at slightly above $2.0 M/MW. But CRU estimates that a technologically equivalent, commercially viable Chinese system would cost about $1.3 M/MW or more, unsubsidized. That is 30–40% below typical Western costs. CRU says the often-repeated "75% lower" claim "deserves closer scrutiny" [2].
Three things drive that adjustment:
- Turndown. Chinese manufacturers typically design for minimum loads of about 30–40%. Western suppliers aim for about 20%, which needs higher current densities and more expensive materials.
- Subsidies. Chinese subsidies cover about 10–20% of confirmed investment or equipment costs, and CRU reports that many manufacturers operate at a loss.
- Durability. CRU warns that frequent start-stop cycling "could accelerate degradation and compromise stack durability."
For PEM, CRU finds that "the cost difference with Western counterparts is not significant." The price story is mostly an alkaline story. If you are still choosing a technology, our AWE vs PEM comparison covers the trade-offs.
What the gap does to your LCOH
Capex flows into LCOH through two multipliers: how many hours the electrolyzer runs, and what your capital costs. At a high capacity factor, each dollar of capex spreads over more kilograms. At a high discount rate, each dollar weighs more. We cover both in electrolyzer capacity factor and LCOH and electrolyzer CAPEX vs discount rate.
That is where turndown bites. A plant fed by variable solar or wind spends many hours at partial power. If the electrolyzer cannot run below 30–40% load, some of that energy is lost or needs a battery or grid backup. Lower utilization pushes LCOH up and can eat part of the capex saving. Hybrid solar-wind supply narrows the problem, but it is project-specific.
Degradation works the same way. Faster stack wear raises power use per kilogram over time and can bring the first stack replacement forward. Neither shows up in a $/kW quote.
The practical point: run the comparison at plant level, with your own hourly renewable profile, financing terms and stack-replacement schedule. A 33% installed-cost gap may become a much smaller LCOH gap. On a stable, high-load supply with cheap capital, it may hold up well.
Where you sell decides what you can buy
For EU-subsidized projects, origin rules can outweigh price. In the third Hydrogen Bank auction, at least 75% of a project's electrolyzers had to originate outside China, stacks could not be of Chinese origin, and no more than two other main components could come from China [4]. The second auction capped Chinese stacks at 25% of MWe.
The fourth auction (IF26) draft terms keep the 75% rule [6]. Applicants must provide manufacturer declarations on manufacturing location and the origin of electrolyzers and stacks. Winners' planned electrolyzer origin will be published, and compliance will be monitored during implementation.
Suppliers are adapting. RCT GH Hydrogen, a joint venture between Germany's RCT Group and Chinese manufacturer Guofu Hydrogen, will build its 10 MW pressurized alkaline unit for Sines at RCT's facility in Germany [8]. How such units are classified under each auction's origin rules is a question to settle with your legal team before you bid.
Outside EU subsidy schemes, the rules are different. Chinese export orders in the first half of 2026 reached projects in India, Morocco, Kenya, Oman, Saudi Arabia, Kazakhstan, Paraguay and Australia, among others [9]. If your molecules go to Europe as RFNBOs, keep the delegated act revision and your export corridor in view. Equipment origin is a separate question from RFNBO compliance.
A five-point check before you compare quotes
- Normalize scope. Ex-factory, system and installed prices are different numbers. Ask each supplier what is inside the quote: rectifiers, gas conditioning, controls, commissioning.
- Test turndown against your profile. Model a 20% and a 40% minimum load on the same hourly renewable data and compare annual output.
- Price the stack's life. Ask for degradation guarantees, warranty terms and the expected stack replacement year, then put them in the cash flow.
- Check market eligibility. Confirm whether your subsidy scheme or offtaker restricts equipment origin before you shortlist.
- Check the supplier, not just the price. CRU reports that many Chinese manufacturers run at a loss. Ask for financial statements and reference plants in operation.
Equipment choices feed straight into the economics that decide whether green hydrogen projects reach FID or get cancelled. Settle these five points early.
The bottom line
Chinese alkaline electrolyzers are cheaper, and the gap is real. But the 56% ex-factory gap becomes roughly a third once installed, and CRU puts a like-for-like gap at 30–40%. Turndown, durability, financing and market rules decide how much of that saving reaches your LCOH.
Hyzen helps you run that comparison on your own site. Model renewable input, size the electrolyzer, and check water, gas conditioning, compression, storage and RFNBO compliance in one place. Hyzen is building a full LCOH and techno-economic engine on top. Start with the free Site Screener and see how your project's numbers hold up.
References
[1] World Bank Group. Electrolysers for Hydrogen Production: Technical and Economic Characteristics. World Bank (2026).
[2] Ruohan Wang and Paul Butterworth. Chinese green hydrogen has cost benefits, but challenges are emerging. CRU Group (2025).
[3] Green Building Africa. China tightens grip on global electrolyser market as manufacturing capacity surges. Green Building Africa (2026).
[4] oEnergetice. Fewer bidders, more money. Third EU hydrogen auction to distribute €1.1 billion. oEnergetice (2026).
[5] pv magazine. EU publishes draft terms of 4th hydrogen auction. pv magazine (2026).
[6] PNO Innovation. IF26 Hydrogen Auction: draft Terms and Conditions open for consultation. PNO Innovation (2026).
[7] Todos Company. IF26 hydrogen auction: €500 million, launching in December. Todos Company (2026).
[8] AICEP Portugal Global. Sines secures first order for European electrolyser venture. Portugal Global (2026).
[9] Jian Wu. Chinese electrolyser export orders accelerated in H1 2026. China Hydrogen Bulletin (2026).